Correction: This article was revised before publication to remove unsupported explanations for Barbour County's attendance pattern, an estimate that combined separate data surfaces, and a statement about outreach that did not occur. The revised story reports only comparisons supported by current state data.
Alabama's chronic absenteeism rate improved for a second consecutive year in 2024-25. Barbour County↗ET moved sharply in the other direction.
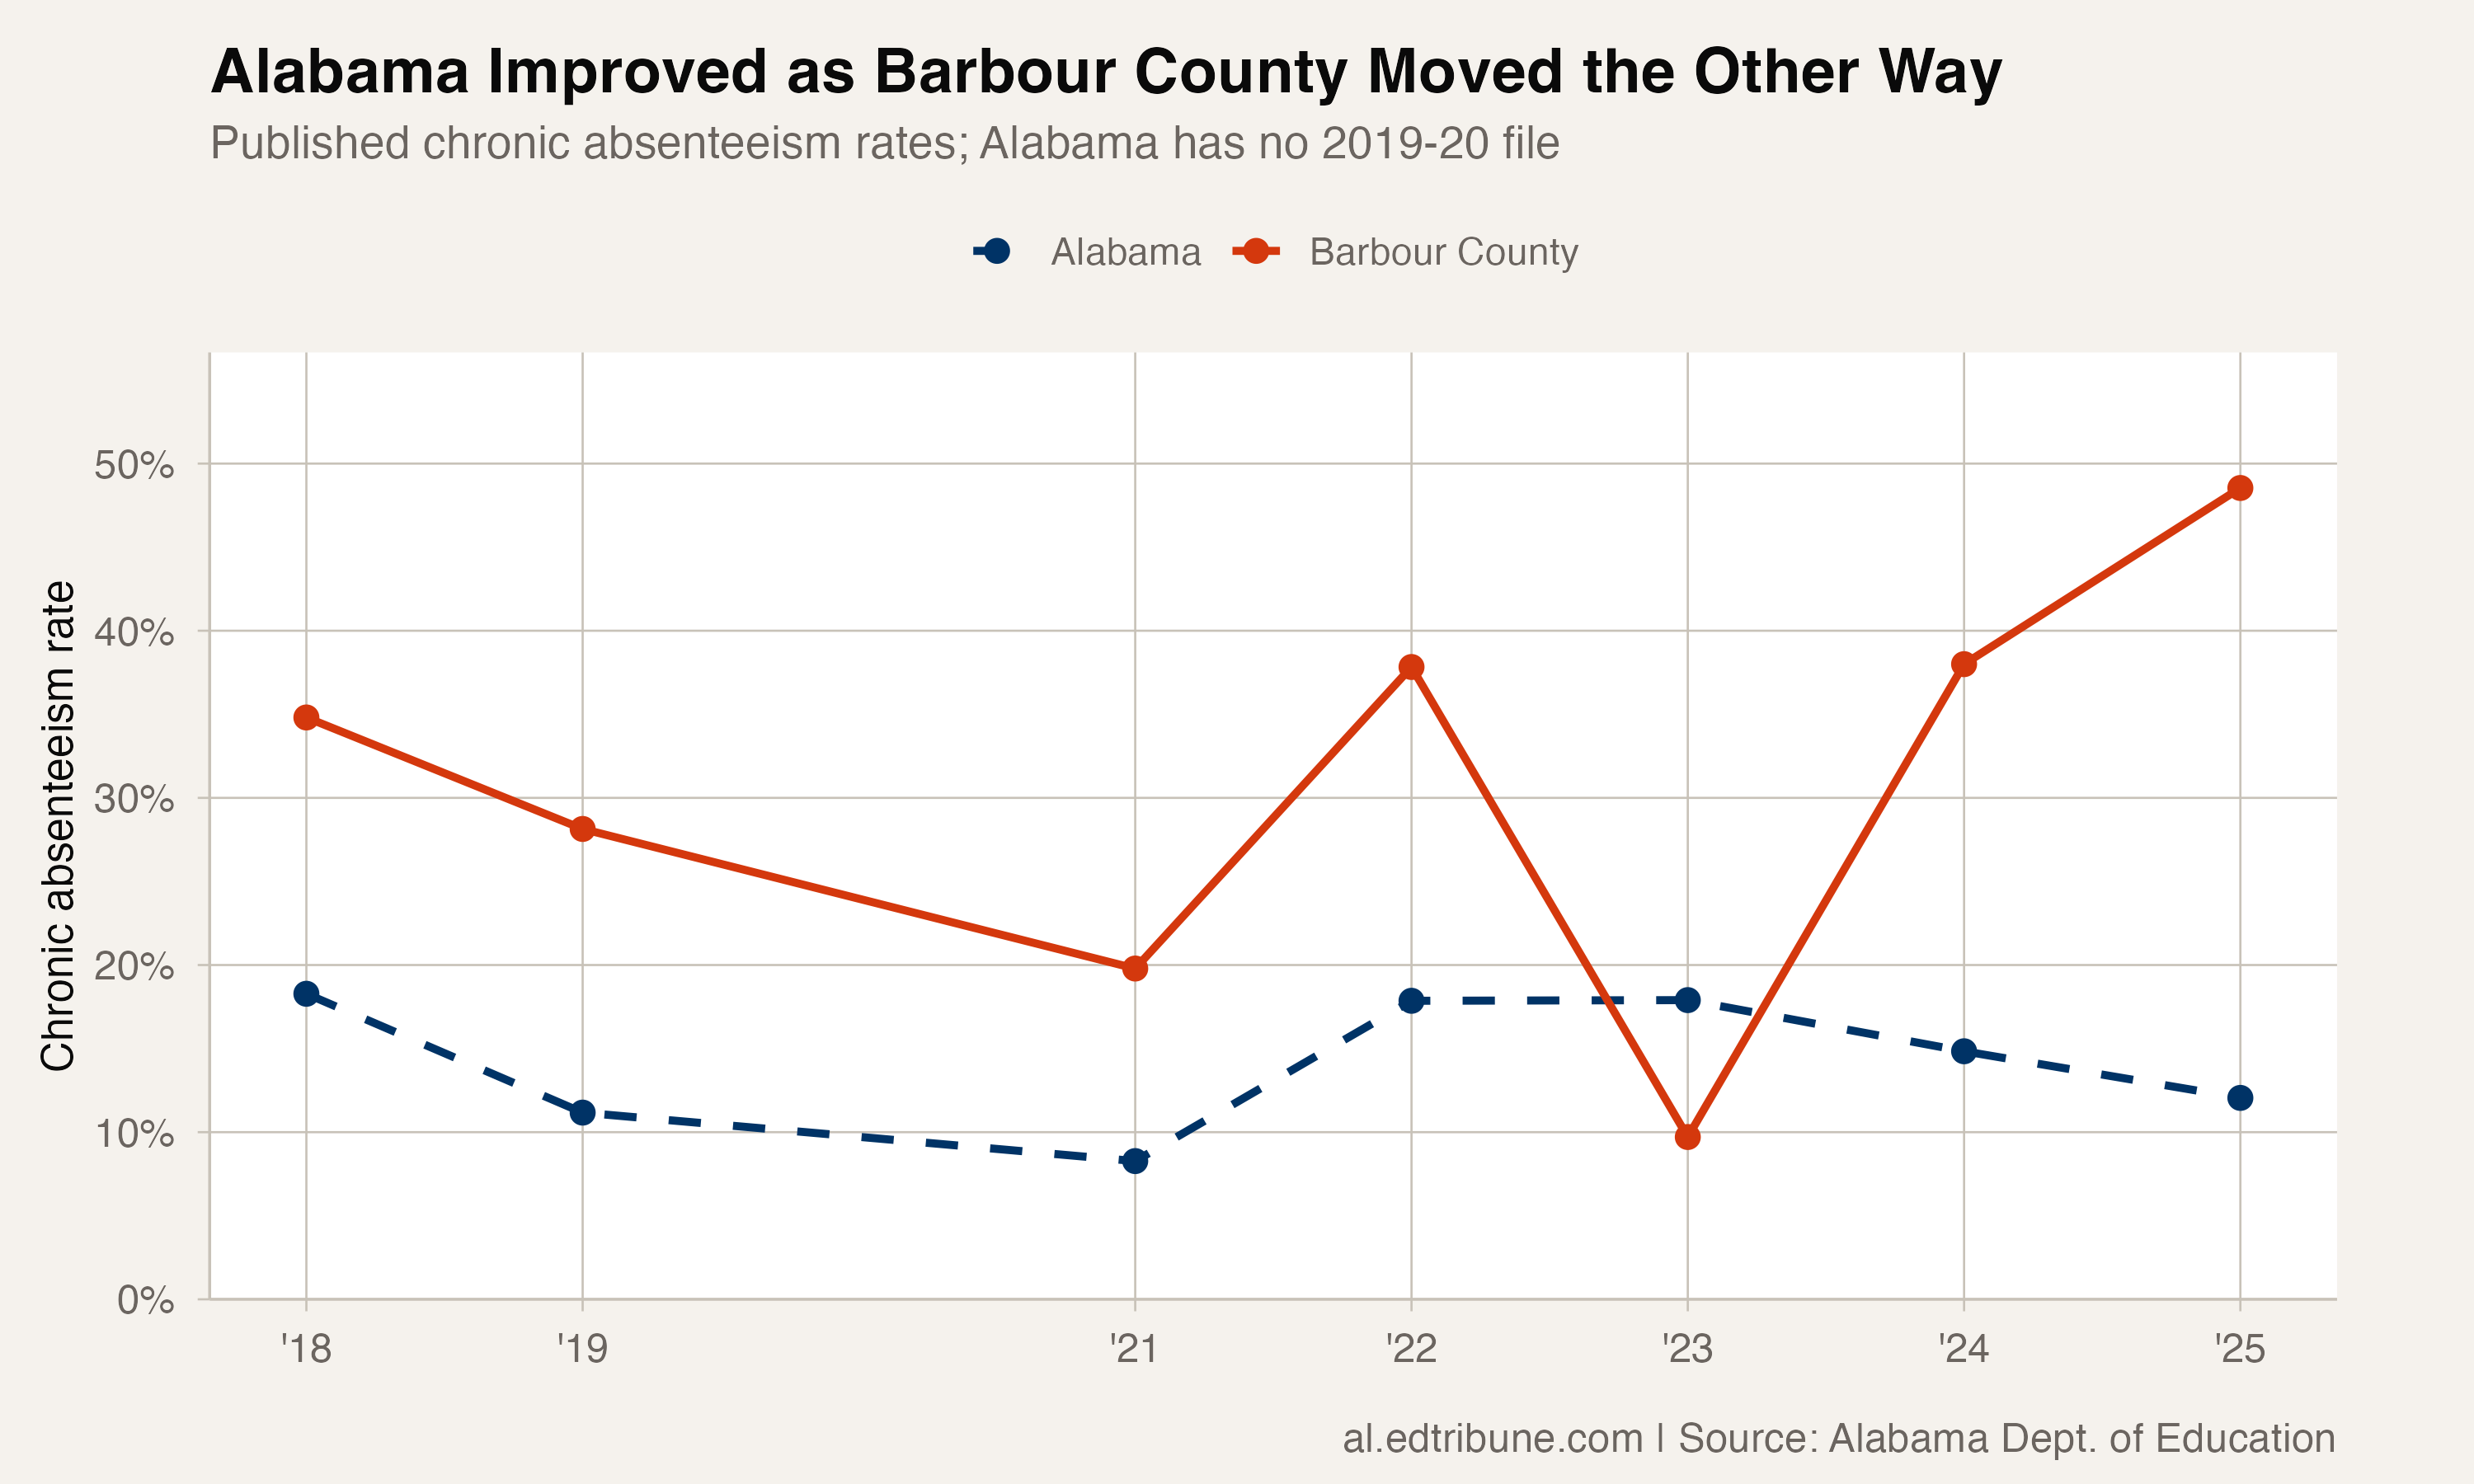
The statewide rate fell from 17.90% in 2022-23 to 12.05% in 2024-25, a decline of 5.85 percentage points across two consecutive annual transitions. Barbour County's rate rose from 38.00% to 48.54% in the latest transition, an increase of 10.54 points.
That left Barbour's published rate about four times the statewide rate.
A statewide outlier
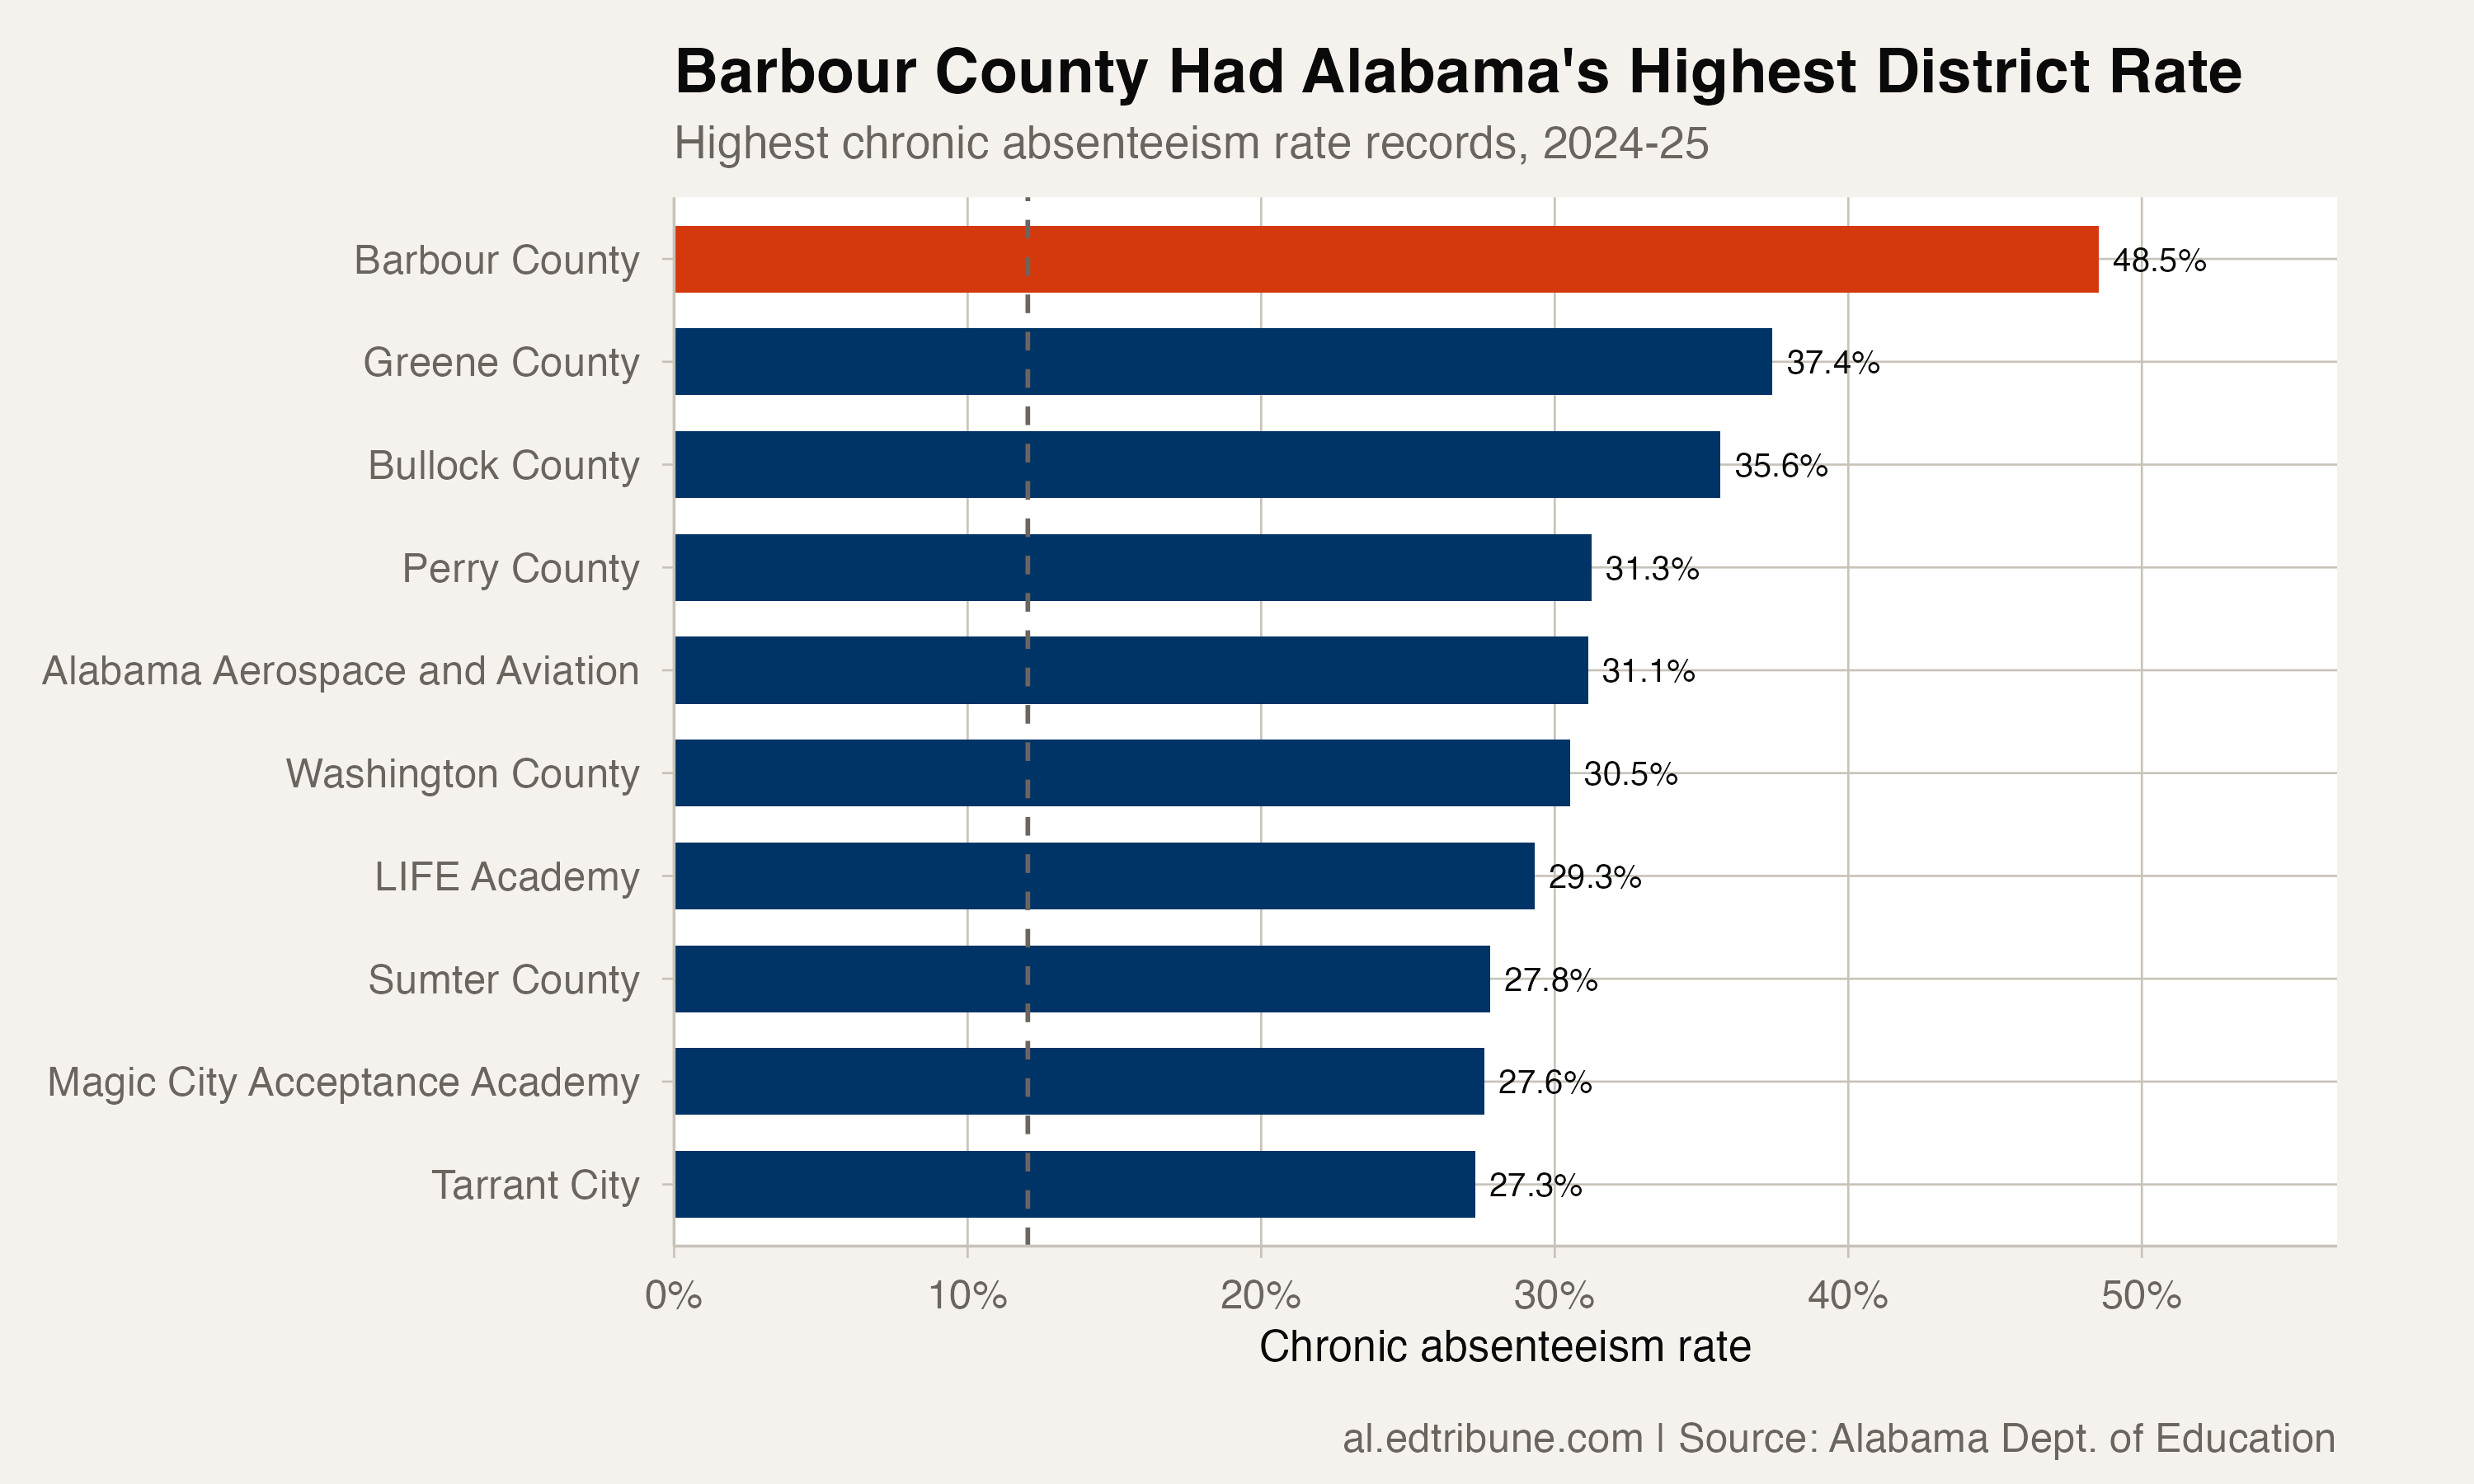
Barbour County had the highest chronic absenteeism rate among every published Alabama district-rate record for 2024-25. Its 48.54% rate was 11.12 points above Greene County↗ET, the next-highest district at 37.42%.
The latest rate was also Barbour County's highest across the seven reporting years available in the package. The district's published series has moved sharply: 37.83% in 2021-22, 9.71% in 2022-23, then increases in each of the next two years to 48.54% in 2024-25.
Those values establish the volatility. They do not establish why the rate fell and rebounded, so the data does not support diagnosing the 2022-23 value as an error.
High rates across reported groups
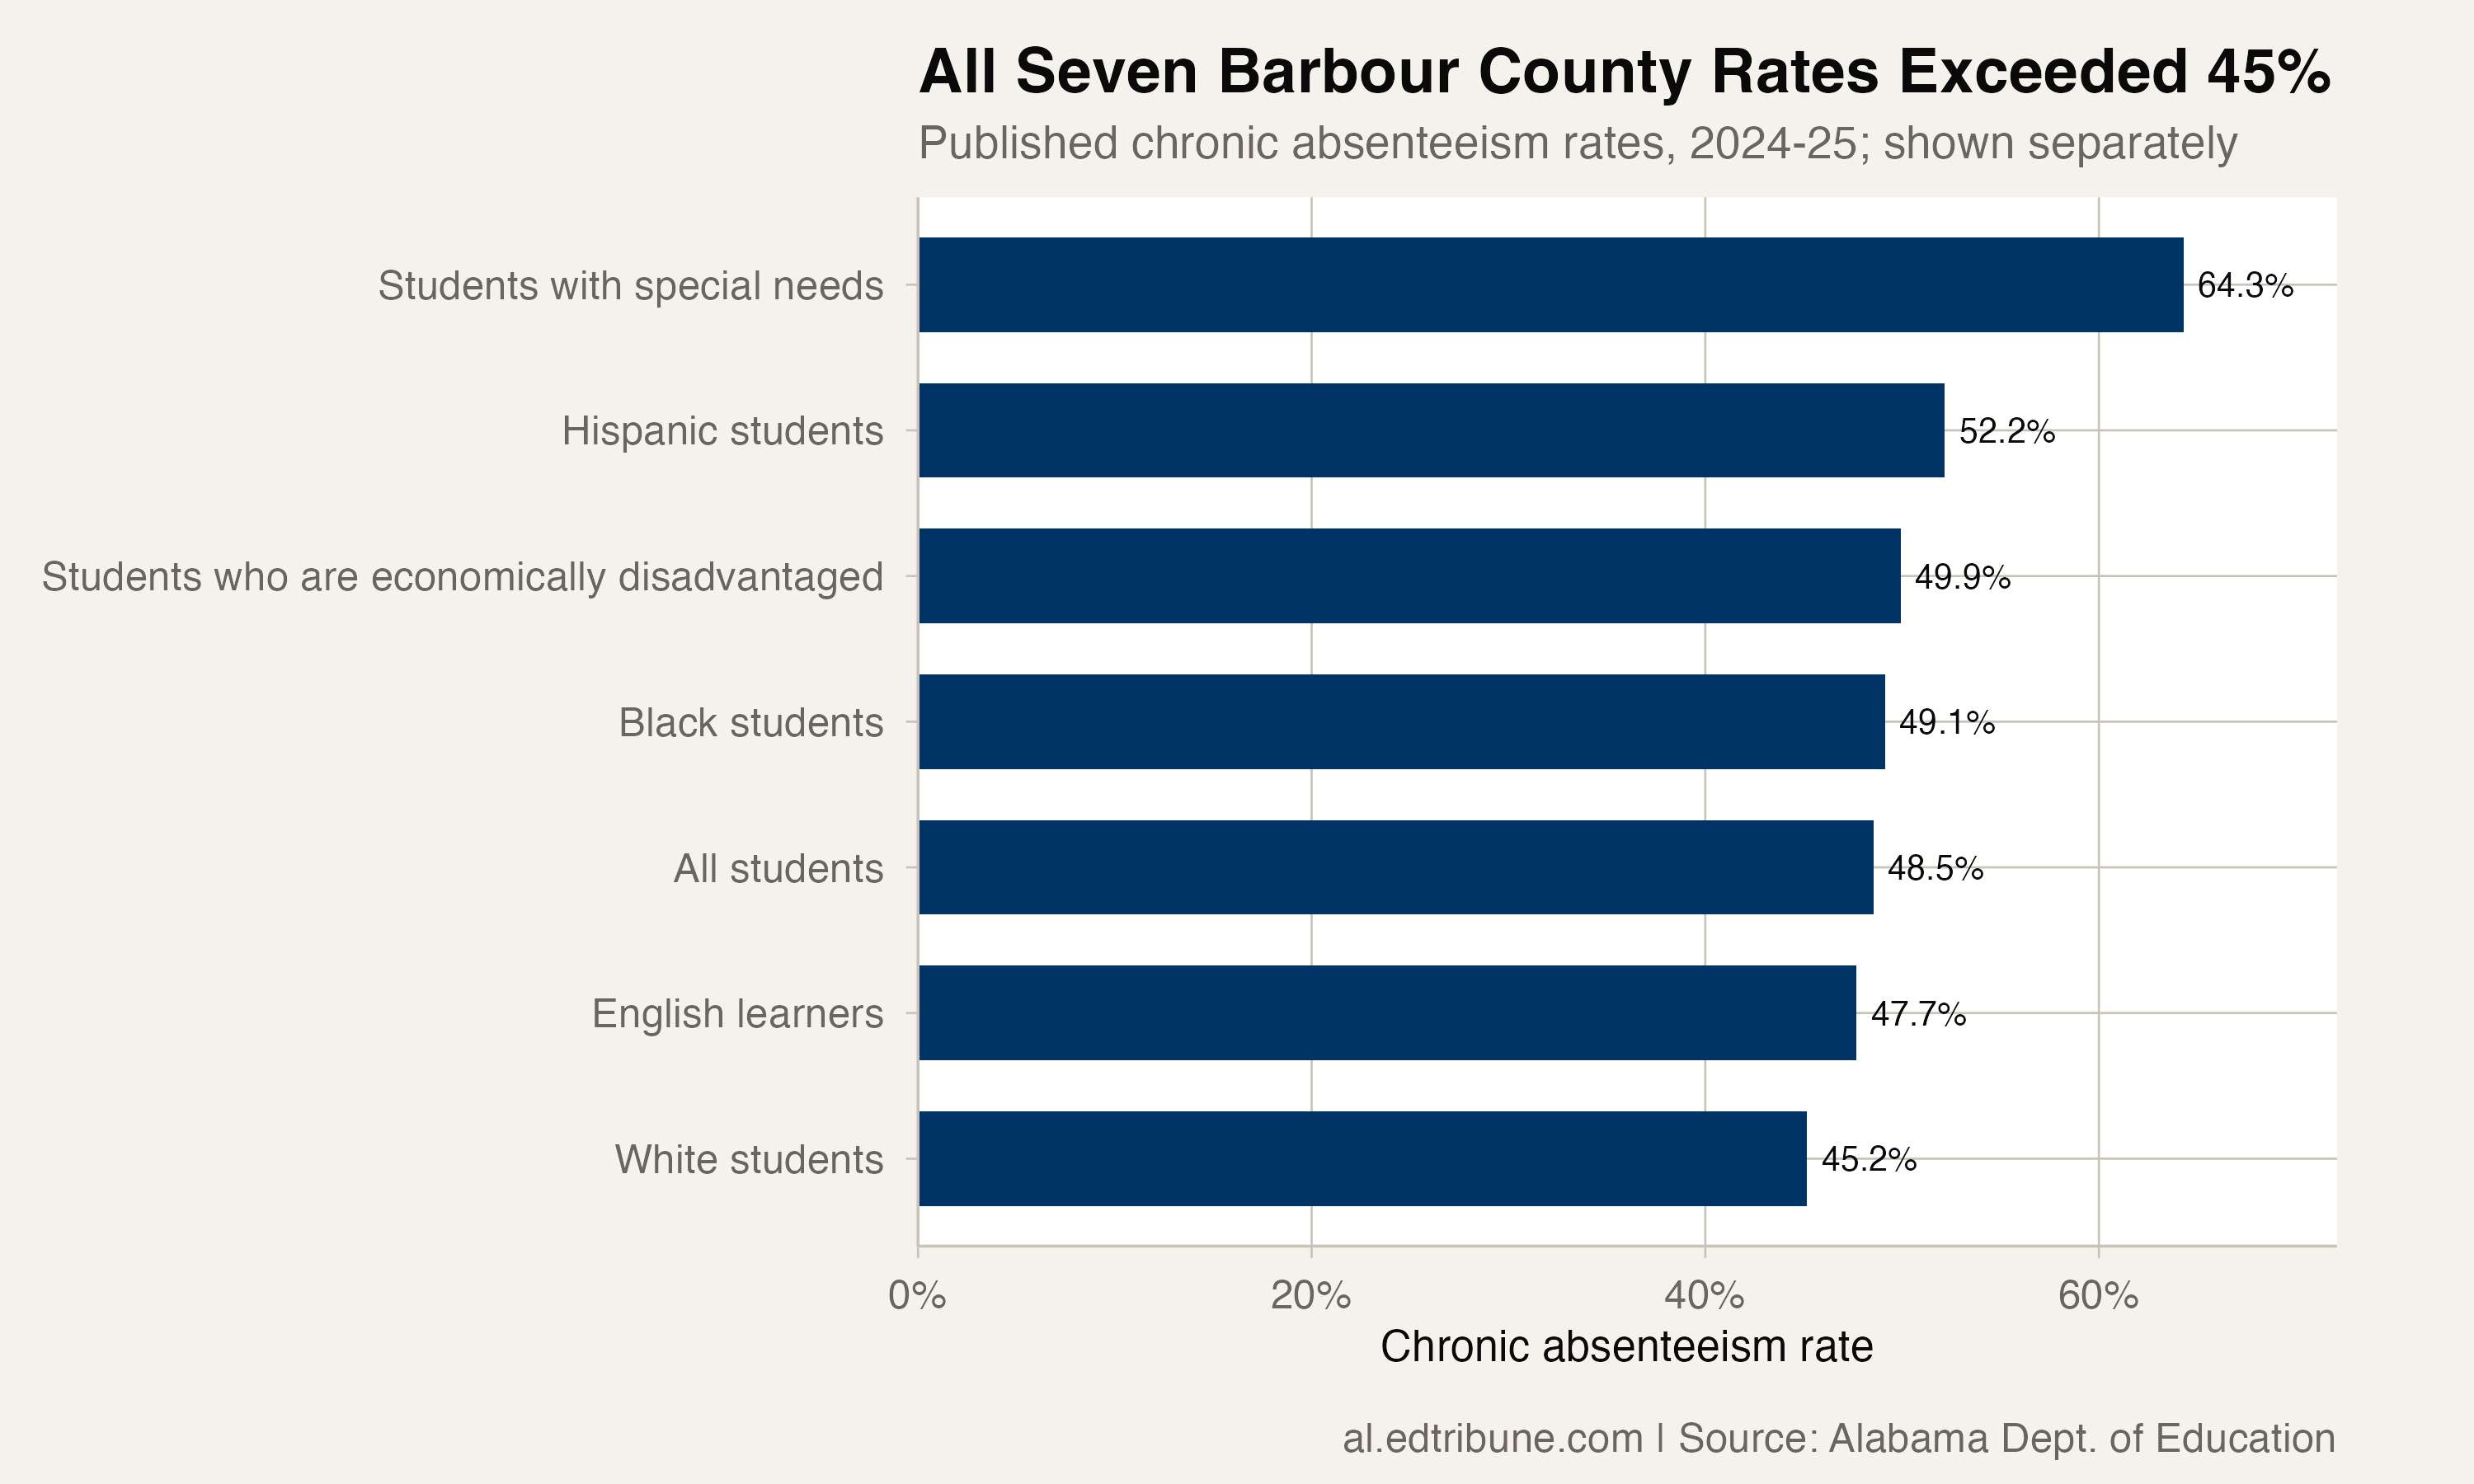
The pattern extends across all seven Barbour County categories reported in the analysis. Published rates ranged from 45.16% for White students to 64.29% for students with special needs. The rate was 52.17% for Hispanic students, 49.92% for students who are economically disadvantaged, 49.13% for Black students, 48.54% for all students and 47.67% for English learners.
The analysis presents each category as its own published rate. It does not add the categories together or treat them as pieces of a single whole.
What the rates can and cannot show
The Alabama absence files used for this analysis publish rates but not usable district enrollment or chronic-absence counts. That means the data supports comparisons across years, districts and reported groups, but not an estimate of how many Barbour County students were chronically absent.
The clearest verified contrast is direction: Alabama's rate declined in both annual transitions from 2022-23 through 2024-25, while Barbour County's rate rose by 10.54 points in the latest year.
Chronic absenteeism rates come from the Alabama State Department of Education's school data reports.
Detailed code that reproduces the analysis and figures in this article is available exclusively to EdTribune subscribers.
Discussion
Sign in to join the discussion.
Loading comments...