Correction (July 21, 2026): An earlier version reported Alabama's 2022 and 2023 English learner chronic-absence rates as 13.82% and 12.91%. The state package returns 13.81% and 12.94%. The article also offered unsupported cultural, employment and community explanations for the attendance pattern and described demographic facts that this dataset does not measure. Those claims have been removed. The revised article reports only comparisons reproduced from Alabama's chronic-absence data, and its charts have been rebuilt from the current analysis.
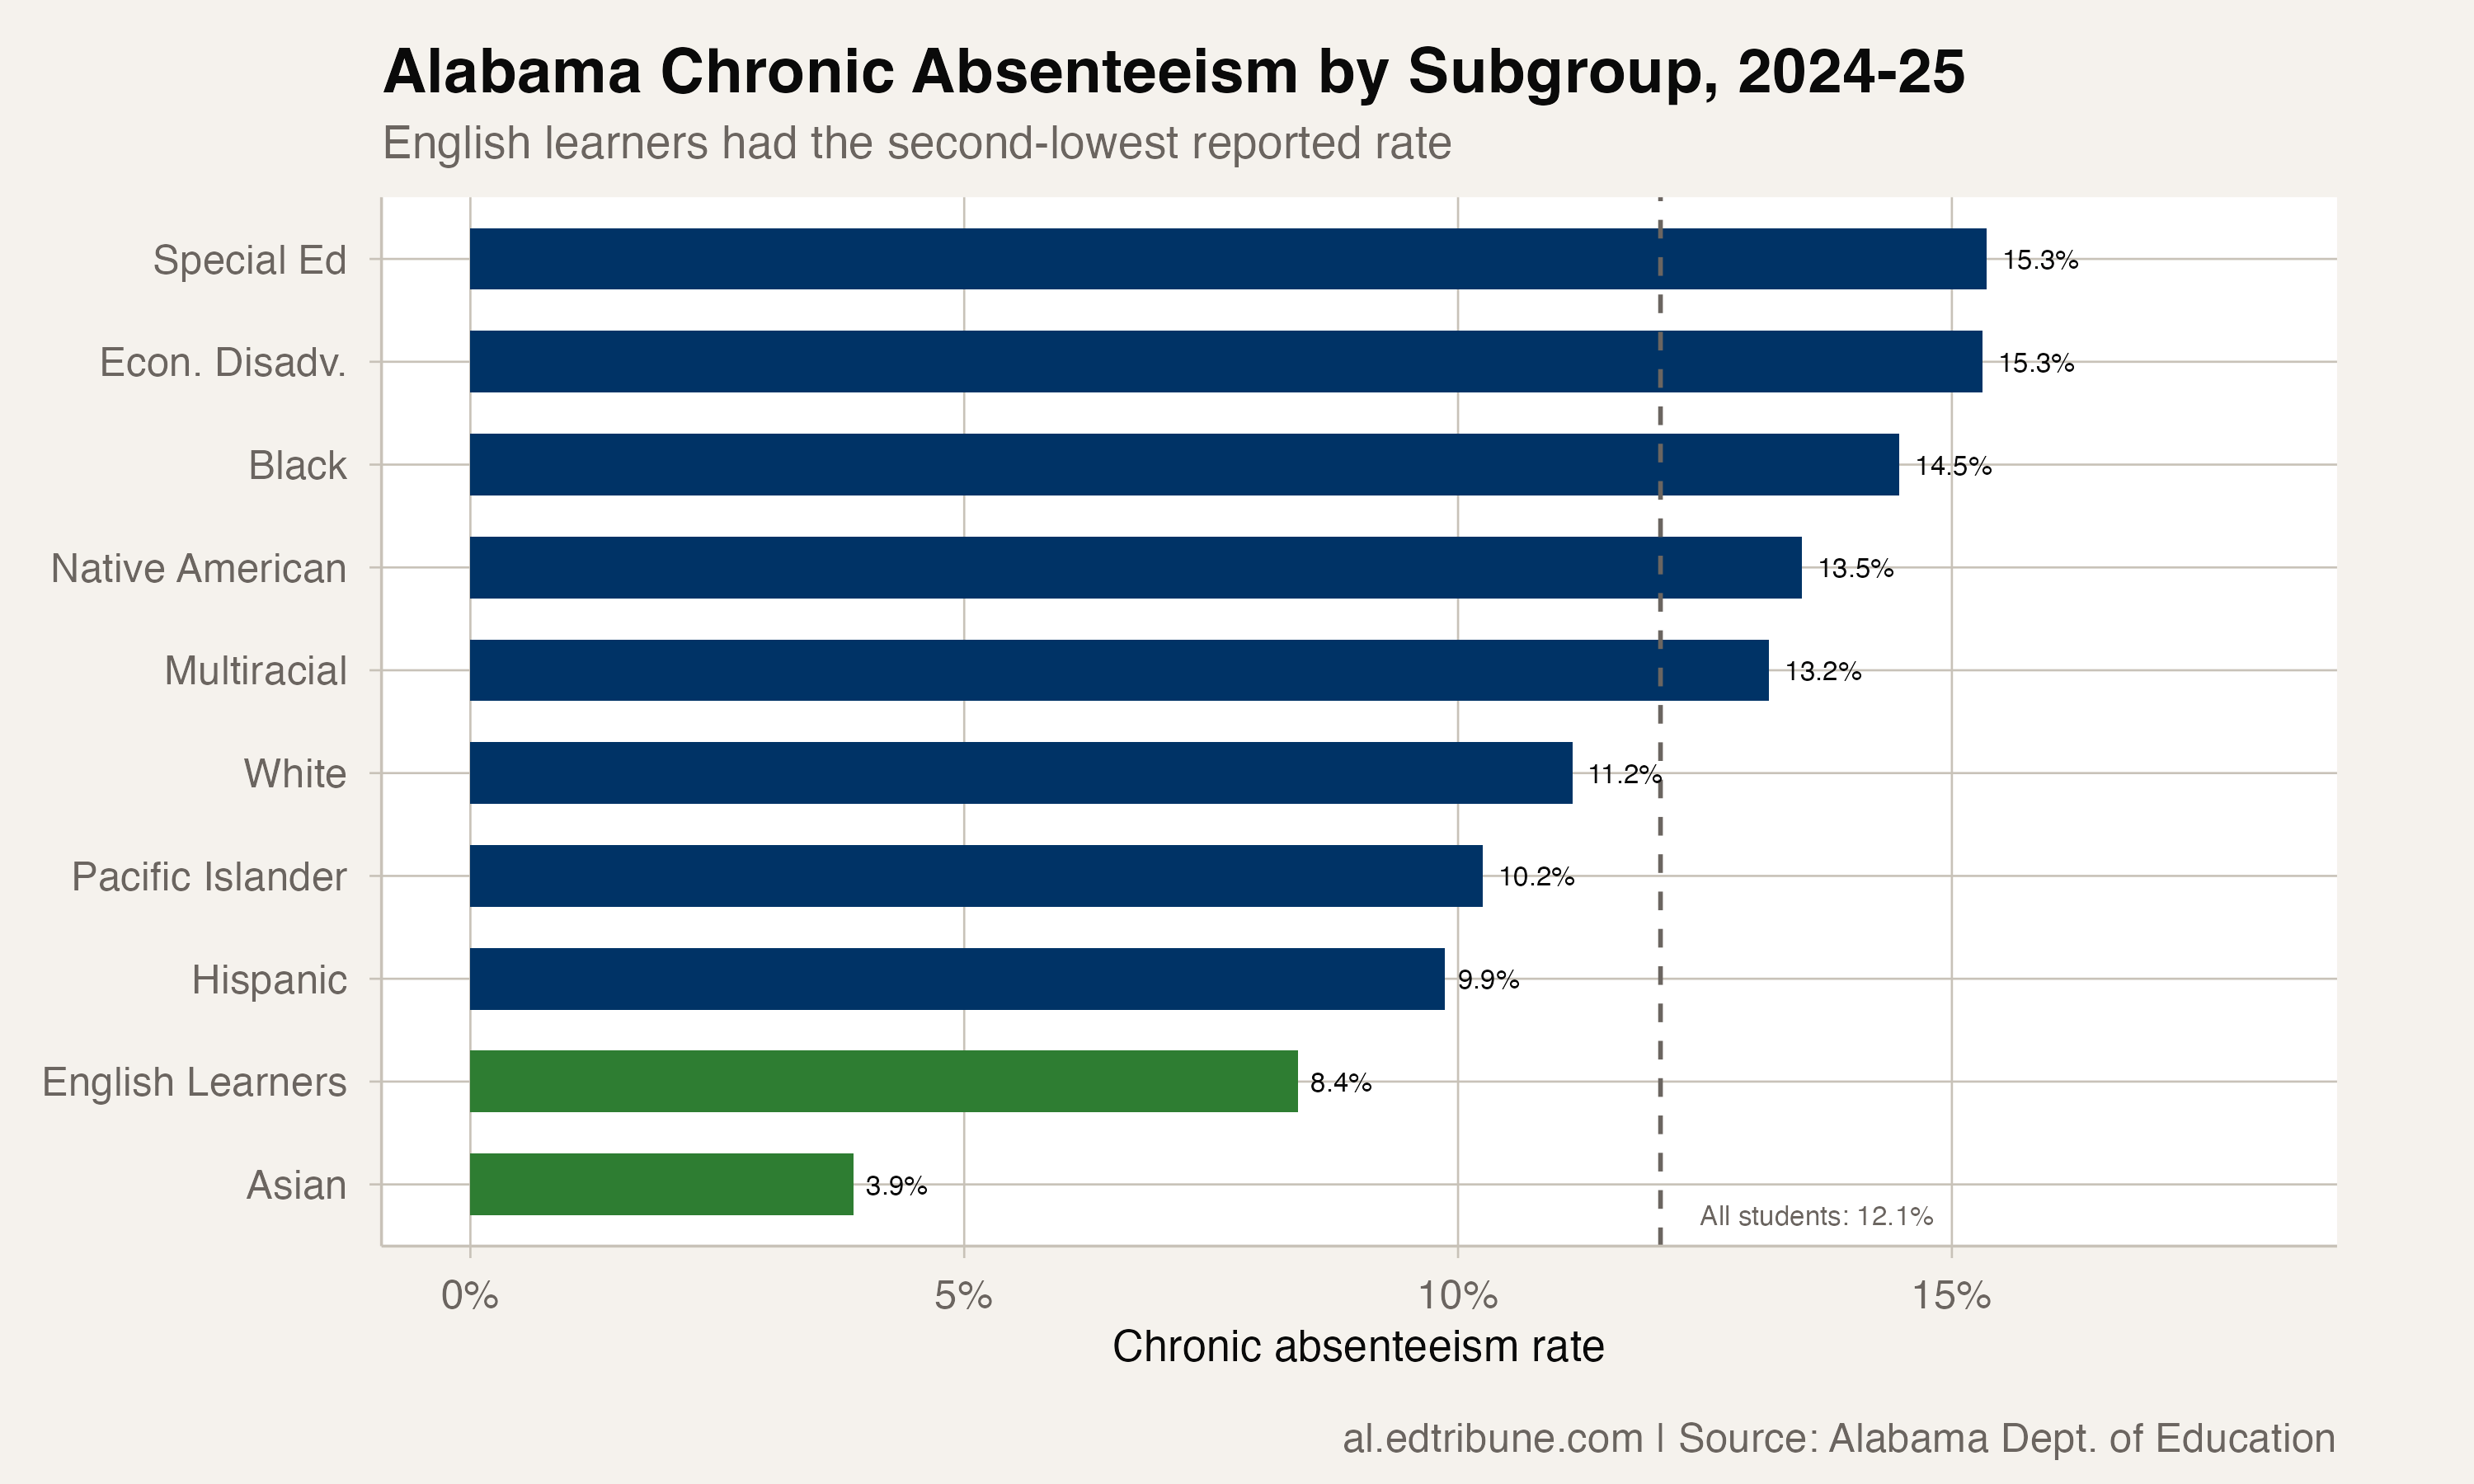
English learners in Alabama had a chronic absenteeism rate of 8.38% in 2024-25, the second-lowest reported subgroup rate. Only Asian students had a lower rate, at 3.88%. English learners were below the statewide rate in all seven reported school years available in the package between 2017-18 and 2024-25.
English learners' 2025 rate was 3.67 percentage points below the all-student rate of 12.05%. It was also below the reported rates for white students (11.16%), Hispanic students (9.87%), economically disadvantaged students (15.31%) and Black students (14.47%).
Below the statewide rate in seven years
In 2017-18, the first year available in the package, the statewide rate was 18.28% and the English learner rate was 9.92%, a difference of 8.36 percentage points. In 2020-21, the English learner rate was 7.01%, compared with 8.27% statewide.
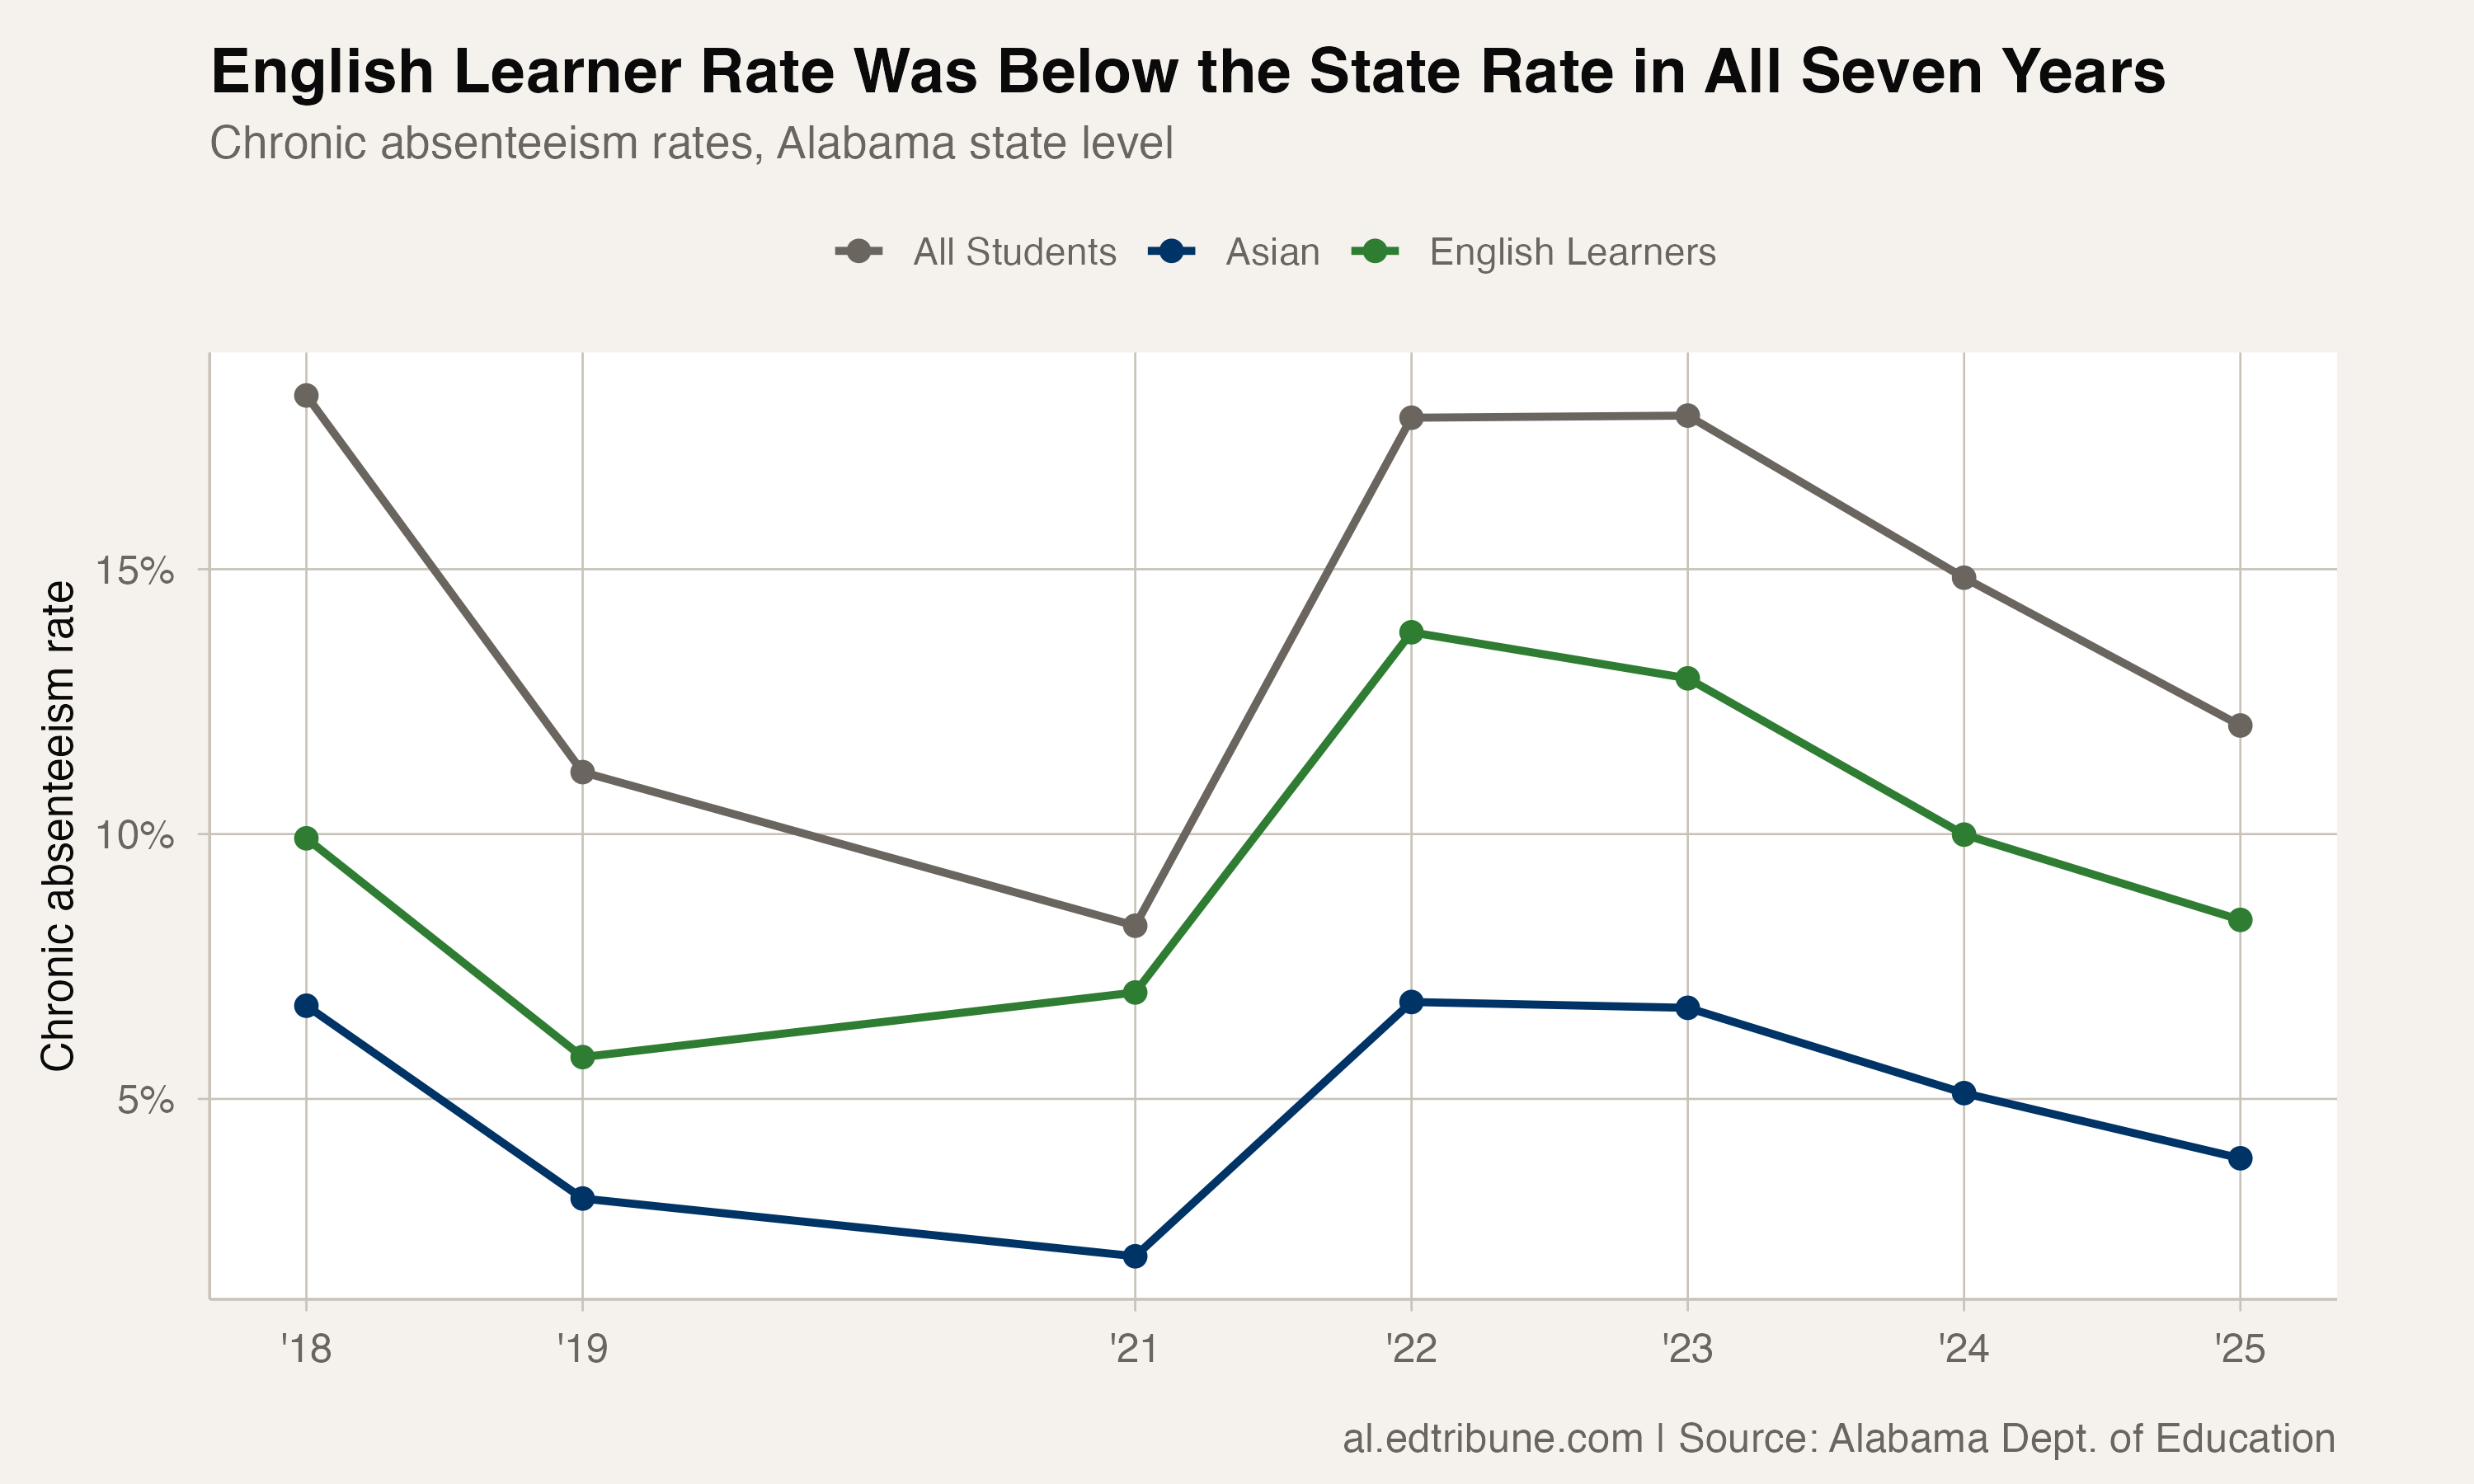
In 2021-22, the English learner rate was 13.81%, compared with 17.86% statewide. The English learner series then declined each year: 13.81% in 2022, 12.94% in 2023, 9.99% in 2024 and 8.38% in 2025.
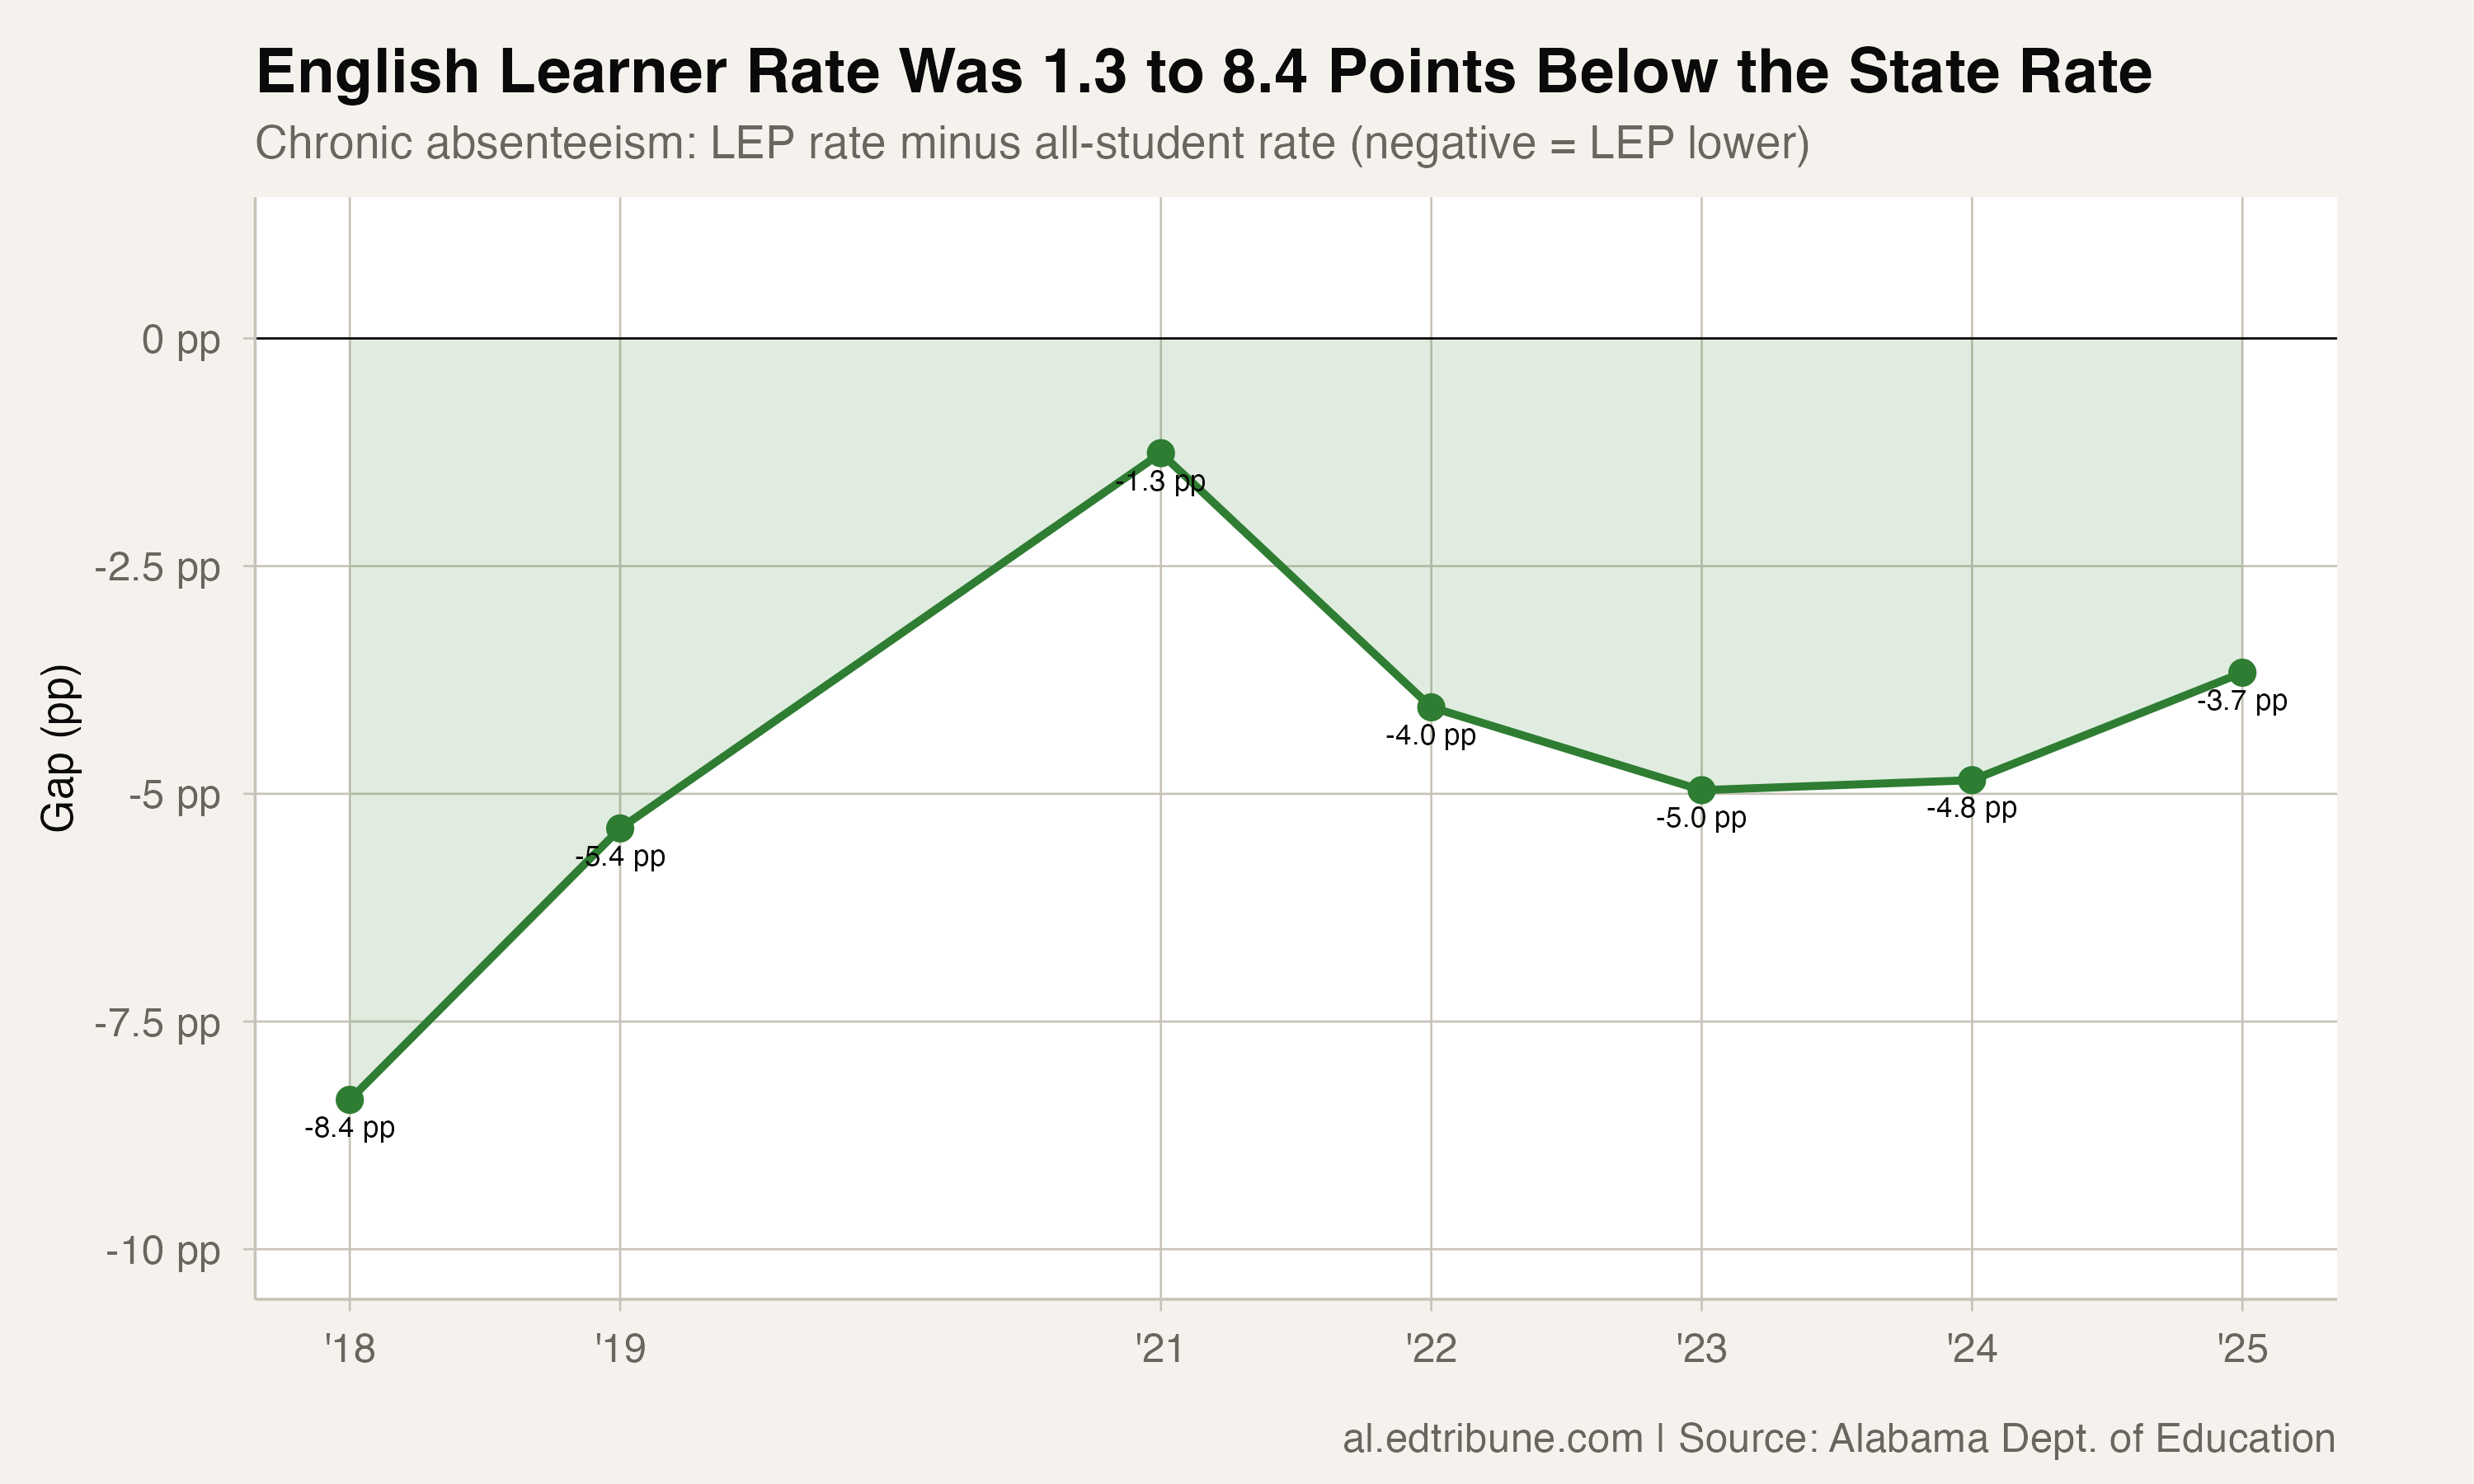
Across the seven reported years, the English learner rate ranged from 1.26 to 8.36 percentage points below the statewide rate. From 2023 through 2025, the differences were 4.96, 4.85 and 3.67 points.
Almost universal across districts
In 110 of 120 districts that reported English learner chronic-absence rates in 2025 (91.7%), the English learner rate was below the district's overall rate.
In Russellville City, the English learner rate was 4.03%, compared with 9.07% overall. In Fort Payne City, it was 4.89%, compared with 10.39%. In Cullman County, it was 4.13%, compared with 10.66%.
In Bullock County, the overall rate was 35.65% and the English learner rate was 16.3%, 19.3 points below the district rate.
What the data cannot explain
The 2025 state rows show the highest chronic-absence rates among the listed subgroups for special education students (15.35%), economically disadvantaged students (15.31%) and Black students (14.47%). The package reports outcomes by subgroup; it does not identify why their rates differ. It cannot establish explanations about family motivation, work schedules, community norms, school services or individual barriers.
Detailed code that reproduces the analysis and figures in this article is available exclusively to EdTribune subscribers.
Discussion
Sign in to join the discussion.
Loading comments...