Huntsville City Schools brought chronic absenteeism below its pre-pandemic level in 2024-25. Among Alabama districts with comparable published records, 55 of 137, or 40%, were at or below their 2018-19 rates.
The district's rate dropped to 8.23% in 2024-25, well below its pre-COVID baseline of 11.41% from 2018-19. That 3.18 percentage point improvement beyond the baseline came after three consecutive years of decline from a COVID peak of 18.84% in 2021-22.
In a state where most districts are still fighting to get back to pre-pandemic levels, Huntsville has already moved past that benchmark and kept going.
Three years of steady progress
Huntsville's recovery has been gradual and consistent rather than dramatic. After peaking at 18.84% in 2021-22, the rate declined each year: 18.11% in 2022-23, 13.35% in 2023-24, 8.23% in 2024-25. The first of those steps was small, less than a point, and the two that followed were close to 5 points each.
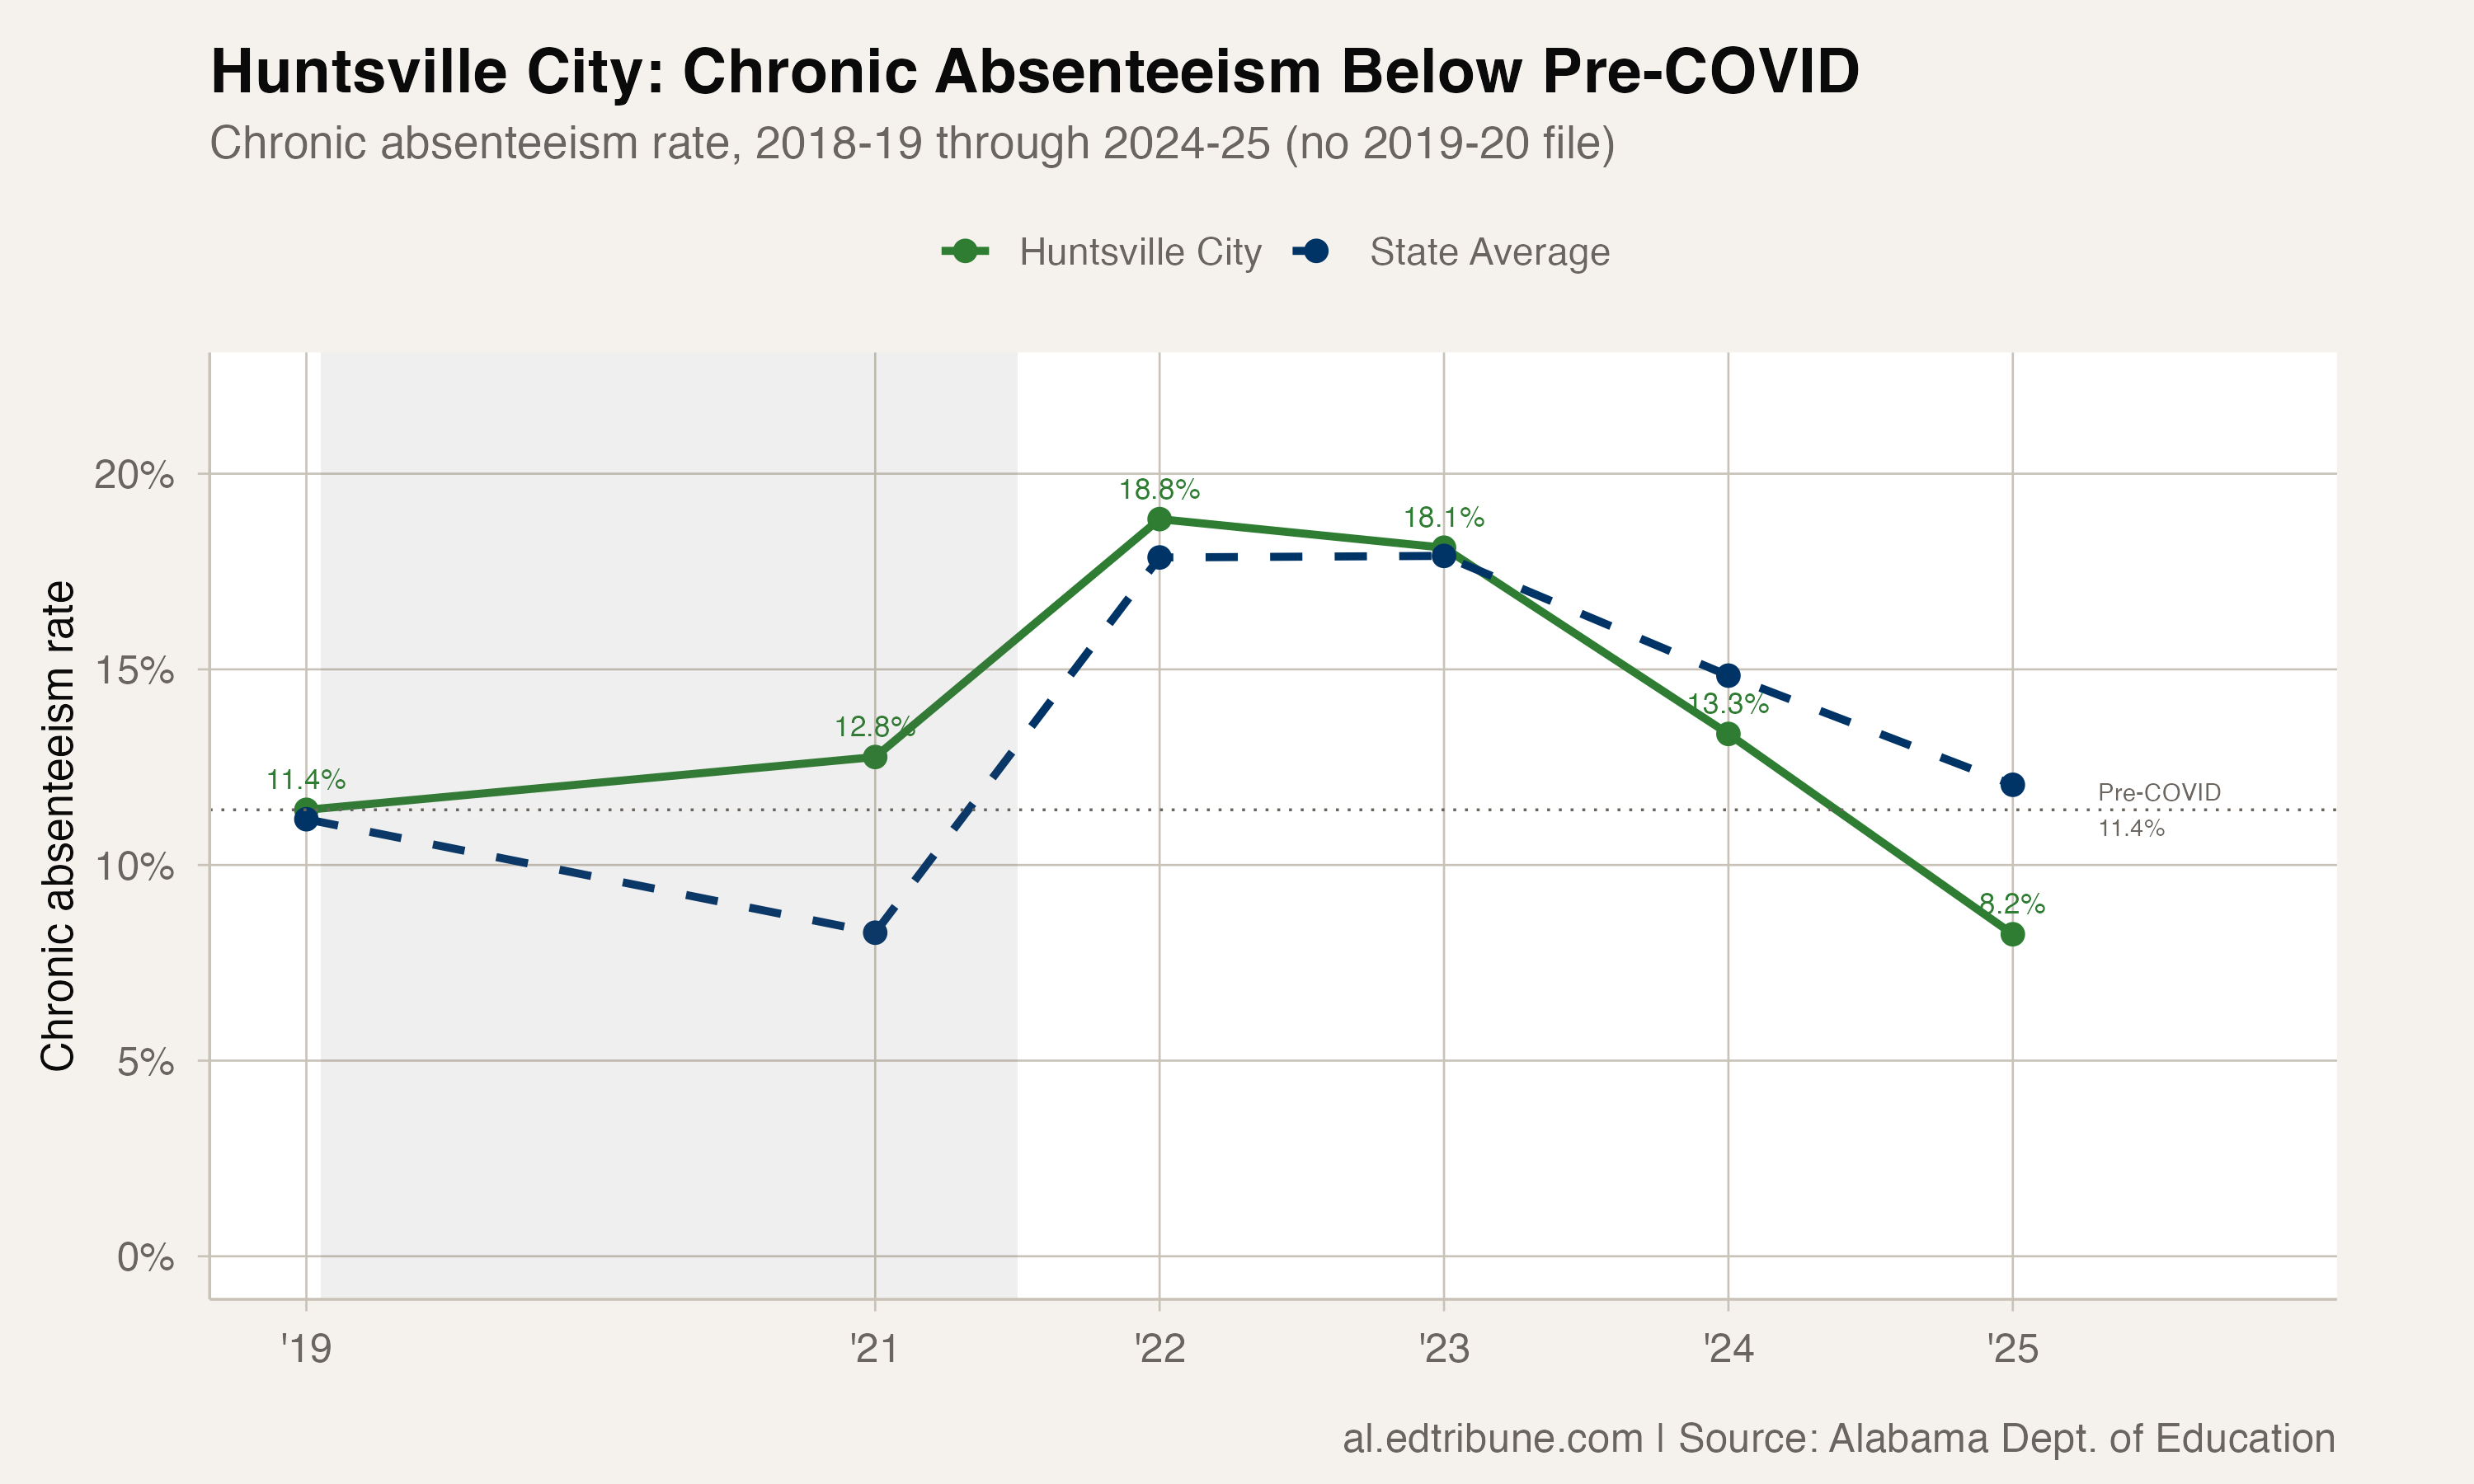
Huntsville sustained its decline for three straight years, and its 2024-25 rate of 8.23% is the lowest the district has recorded in any year the state has published. This comparison begins in 2018-19; the state data used here have no chronic-absence figures for 2019-20.
Asked what changed after the 2021-22 peak, the district described a change in method rather than a new program. Huntsville City Schools "strengthened its overall attendance framework and moved toward a more proactive, data-driven approach," Ms. Jasmine Green, the district's student welfare coordinator, said in a written statement provided by the school system. "We increased our focus on early identification and intervention rather than waiting until attendance concerns became severe."
Schools review attendance data on a regular cycle and flag students who are beginning to slip. Attendance Task Force teams, Ms. Green wrote, "provide a structured opportunity for school personnel to review individual student needs, identify barriers contributing to absences, and determine appropriate interventions." Cases that need more than a conversation at school go to social workers, who take on barriers that "may include transportation, housing instability, health concerns, family circumstances, or other challenges affecting regular school attendance." Ms. Green described the job as a shared one: "Administrators, teachers, counselors, social workers, nurses, families, and community partners all have a role."
Nearly every student group improved beyond 2018-19
The most striking aspect of Huntsville's recovery is that it extends across almost every student group. Eight of the ten groups the state reports for the district are now below their pre-COVID rates:
Students receiving special education services improved the most, dropping from 16.38% in 2018-19 to 7.75% in 2024-25, an 8.63 percentage point improvement that leaves them below the statewide rate for every group Alabama tracks except Asian students. The rate for students who are economically disadvantaged fell from 16.75% to 11.21%, a 5.54-point improvement. Black students went from 14.49% to 9.56%.
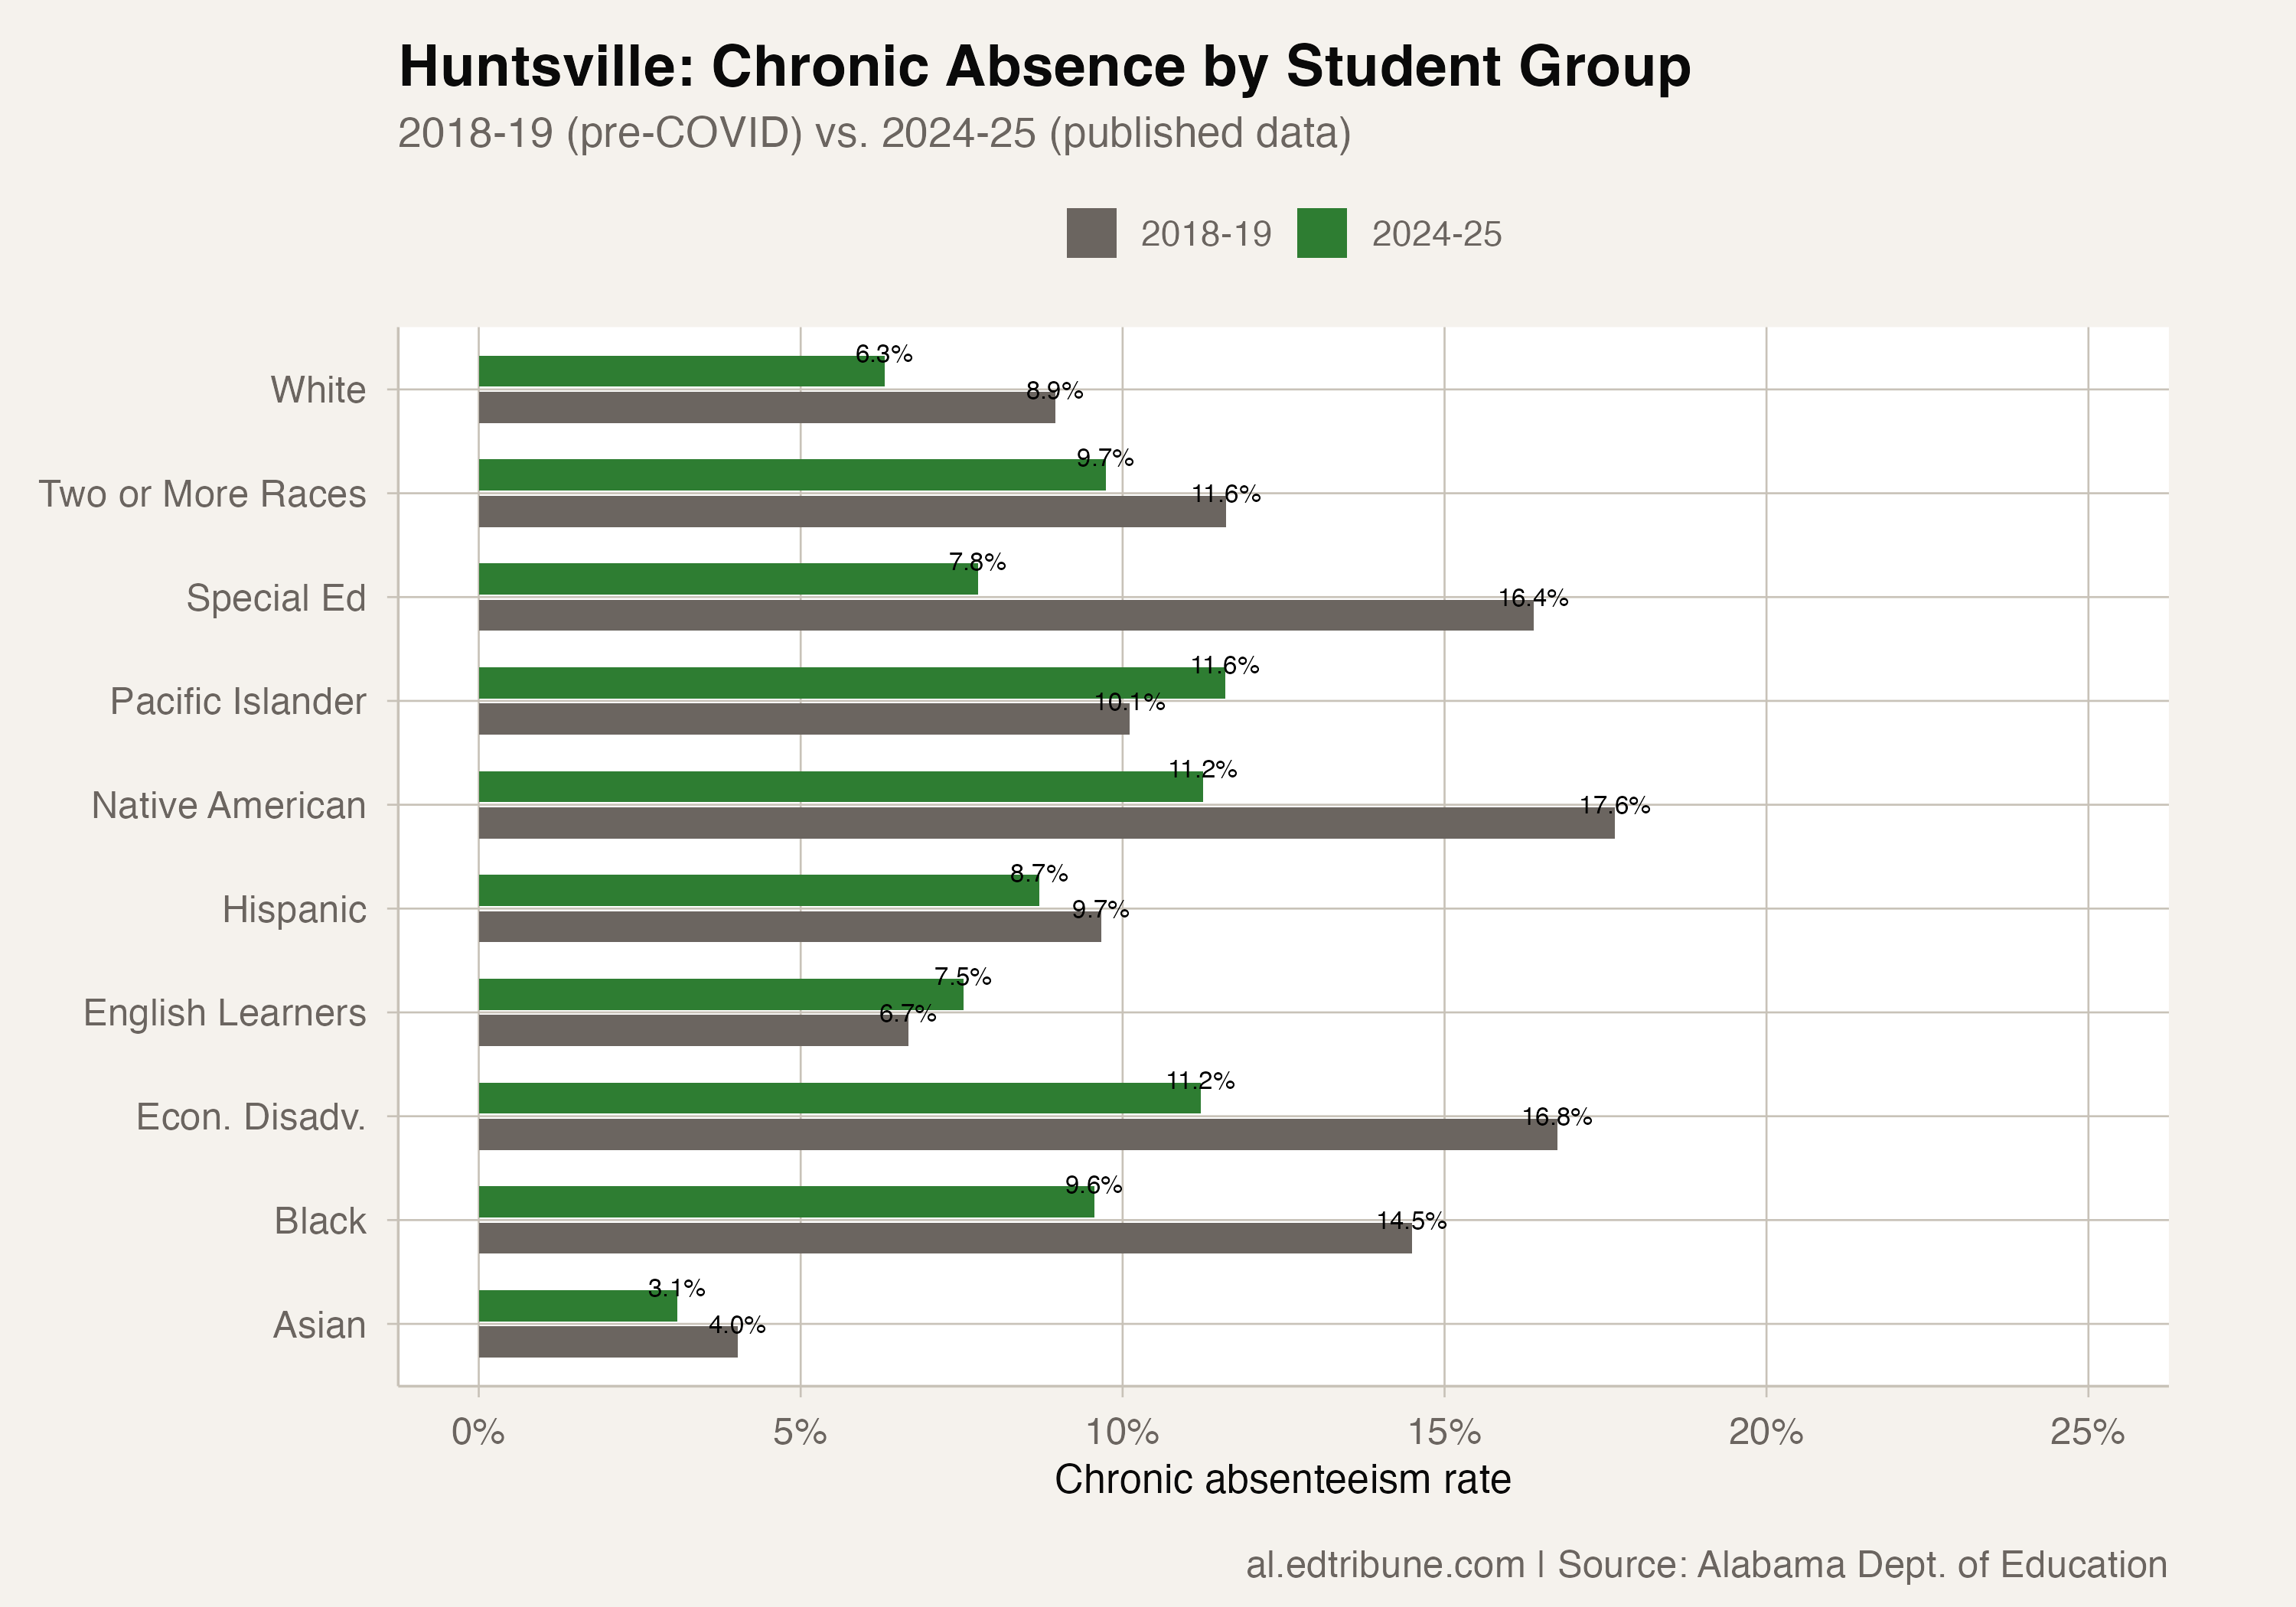
Two groups did not recover. The rate for students learning English rose from 6.67% in 2018-19 to 7.53% in 2024-25, a 0.86 percentage point increase, and Pacific Islander students rose from 10.11% to 11.59%, up 1.48 points. Both changes are small in absolute terms, and 7.53% is still among the lower group rates in the district. Huntsville's English learner enrollment grew over the same period from 1,420 students to 2,441, from about 6% of the district to about 11%, so the group being measured in 2024-25 is substantially larger than the one measured in 2018-19. The Pacific Islander group numbered 105 students in 2024-25, small enough that a handful of students moves the rate by a full point.
Asked whether the district had more to say about that group, Ms. Green sent a second written statement. As Huntsville welcomes "more multilingual and newly arrived families, we are working closely with our ESOL Department and EL Parent Liaisons to identify and address barriers that may impact regular school attendance," she wrote. The liaisons, in her account, "play an important role in helping families navigate the school system, understand attendance expectations and procedures, overcome language and cultural barriers, and connect with needed resources." That collaboration, she wrote, "allows us to provide more targeted support to newly arrived families while continuing to monitor attendance trends within our growing English learner population."
The statement describes an approach rather than a result. The group's rate remains above its 2018-19 level, and these data cannot say what the district's work with families who are new to Huntsville has or has not changed.
Among large districts, a standout
Only five of Alabama's ten largest districts by enrollment have recovered to pre-COVID chronic absenteeism levels. Huntsville's improvement of 3.18 percentage points beyond baseline ranks third among those ten, behind Birmingham City (6.35 points below its 2018-19 rate) and Limestone County (4.01 points).
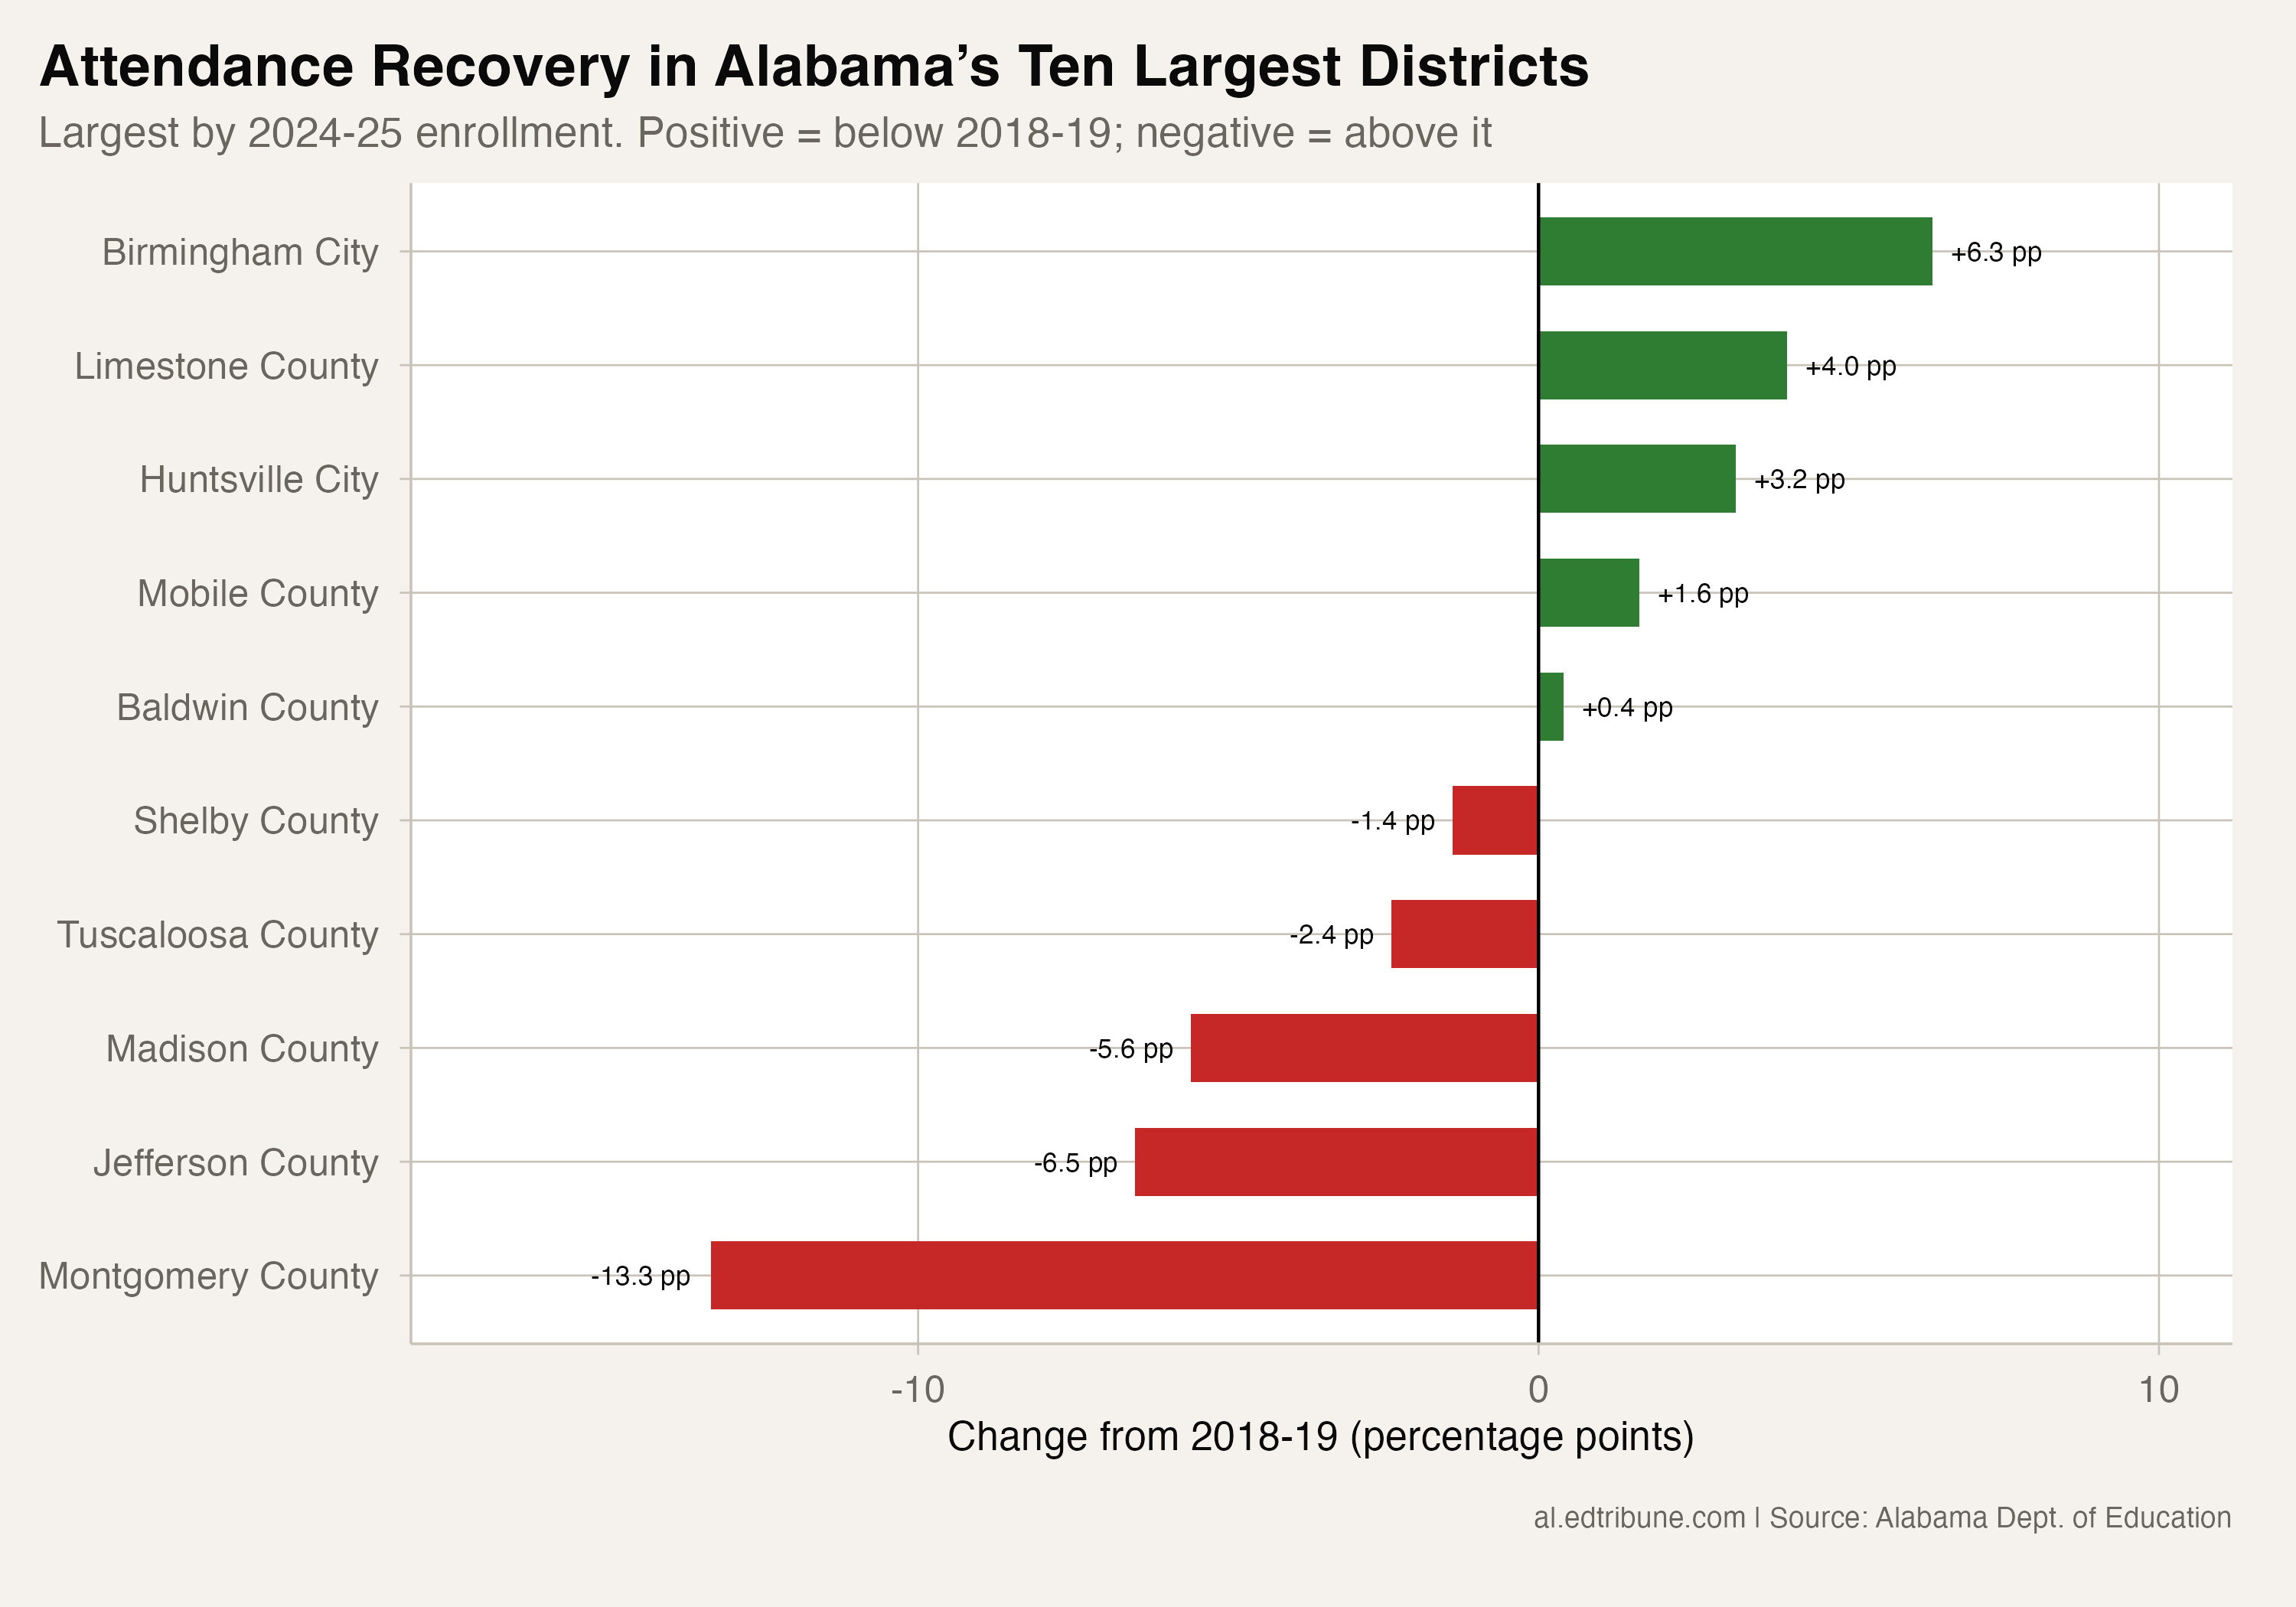
The contrast with its geographic neighbor is stark. Madison County↗ET, which borders Huntsville↗ET, has seen its rate worsen by 5.61 percentage points above its 2018-19 baseline, rising from 8.74% to 14.35%. Two adjacent communities, with the city system outperforming the surrounding county by nearly 9 percentage points relative to their respective starting points.
Jefferson County↗ET sits 6.50 points above its pre-COVID rate. Montgomery County↗ET is 13.34 points above. Against this backdrop, Huntsville's trajectory represents one of the clearest success stories in Alabama attendance data.
What it means at 8.23%
Applied to Huntsville City Schools' published 2024-25 enrollment of 22,776, the 8.23% rate implies roughly 1,900 students who were chronically absent. This is a computed approximation, rather than a published headcount. It is not zero, and two groups sit above the district's overall figure: Black students at 9.56% and economically disadvantaged students at 11.21%. Both are nonetheless well below the statewide rates for those same groups, which were 14.47% and 15.31% in 2024-25.
The district's own account of what sits behind that number is about diagnosis more than enforcement. Families respond best when the approach is "supportive, individualized, and focused on problem-solving," Ms. Green wrote. "A letter or notification may begin the conversation, but direct contact with a family often helps us better understand why a student is missing school."
The districts also serve different student populations. In 2024-25 the state classified 52.7% of Huntsville's students as economically disadvantaged, against 76.7% in Montgomery County and 84.5% in Birmingham↗ET City. These figures describe the students the state classified in each district; they do not isolate the effect of a school system's attendance practices.
The three annual declines document progress. The data do not establish which attendance practices caused it. Ms. Green put the district's aim this way: "Our goal is not simply to tell families that attendance is important; it is to identify what may be preventing a student from attending and determine what support can help that student return to school consistently."
Detailed code that reproduces the analysis and figures in this article is available exclusively to EdTribune subscribers.
Discussion
Sign in to join the discussion.
Loading comments...