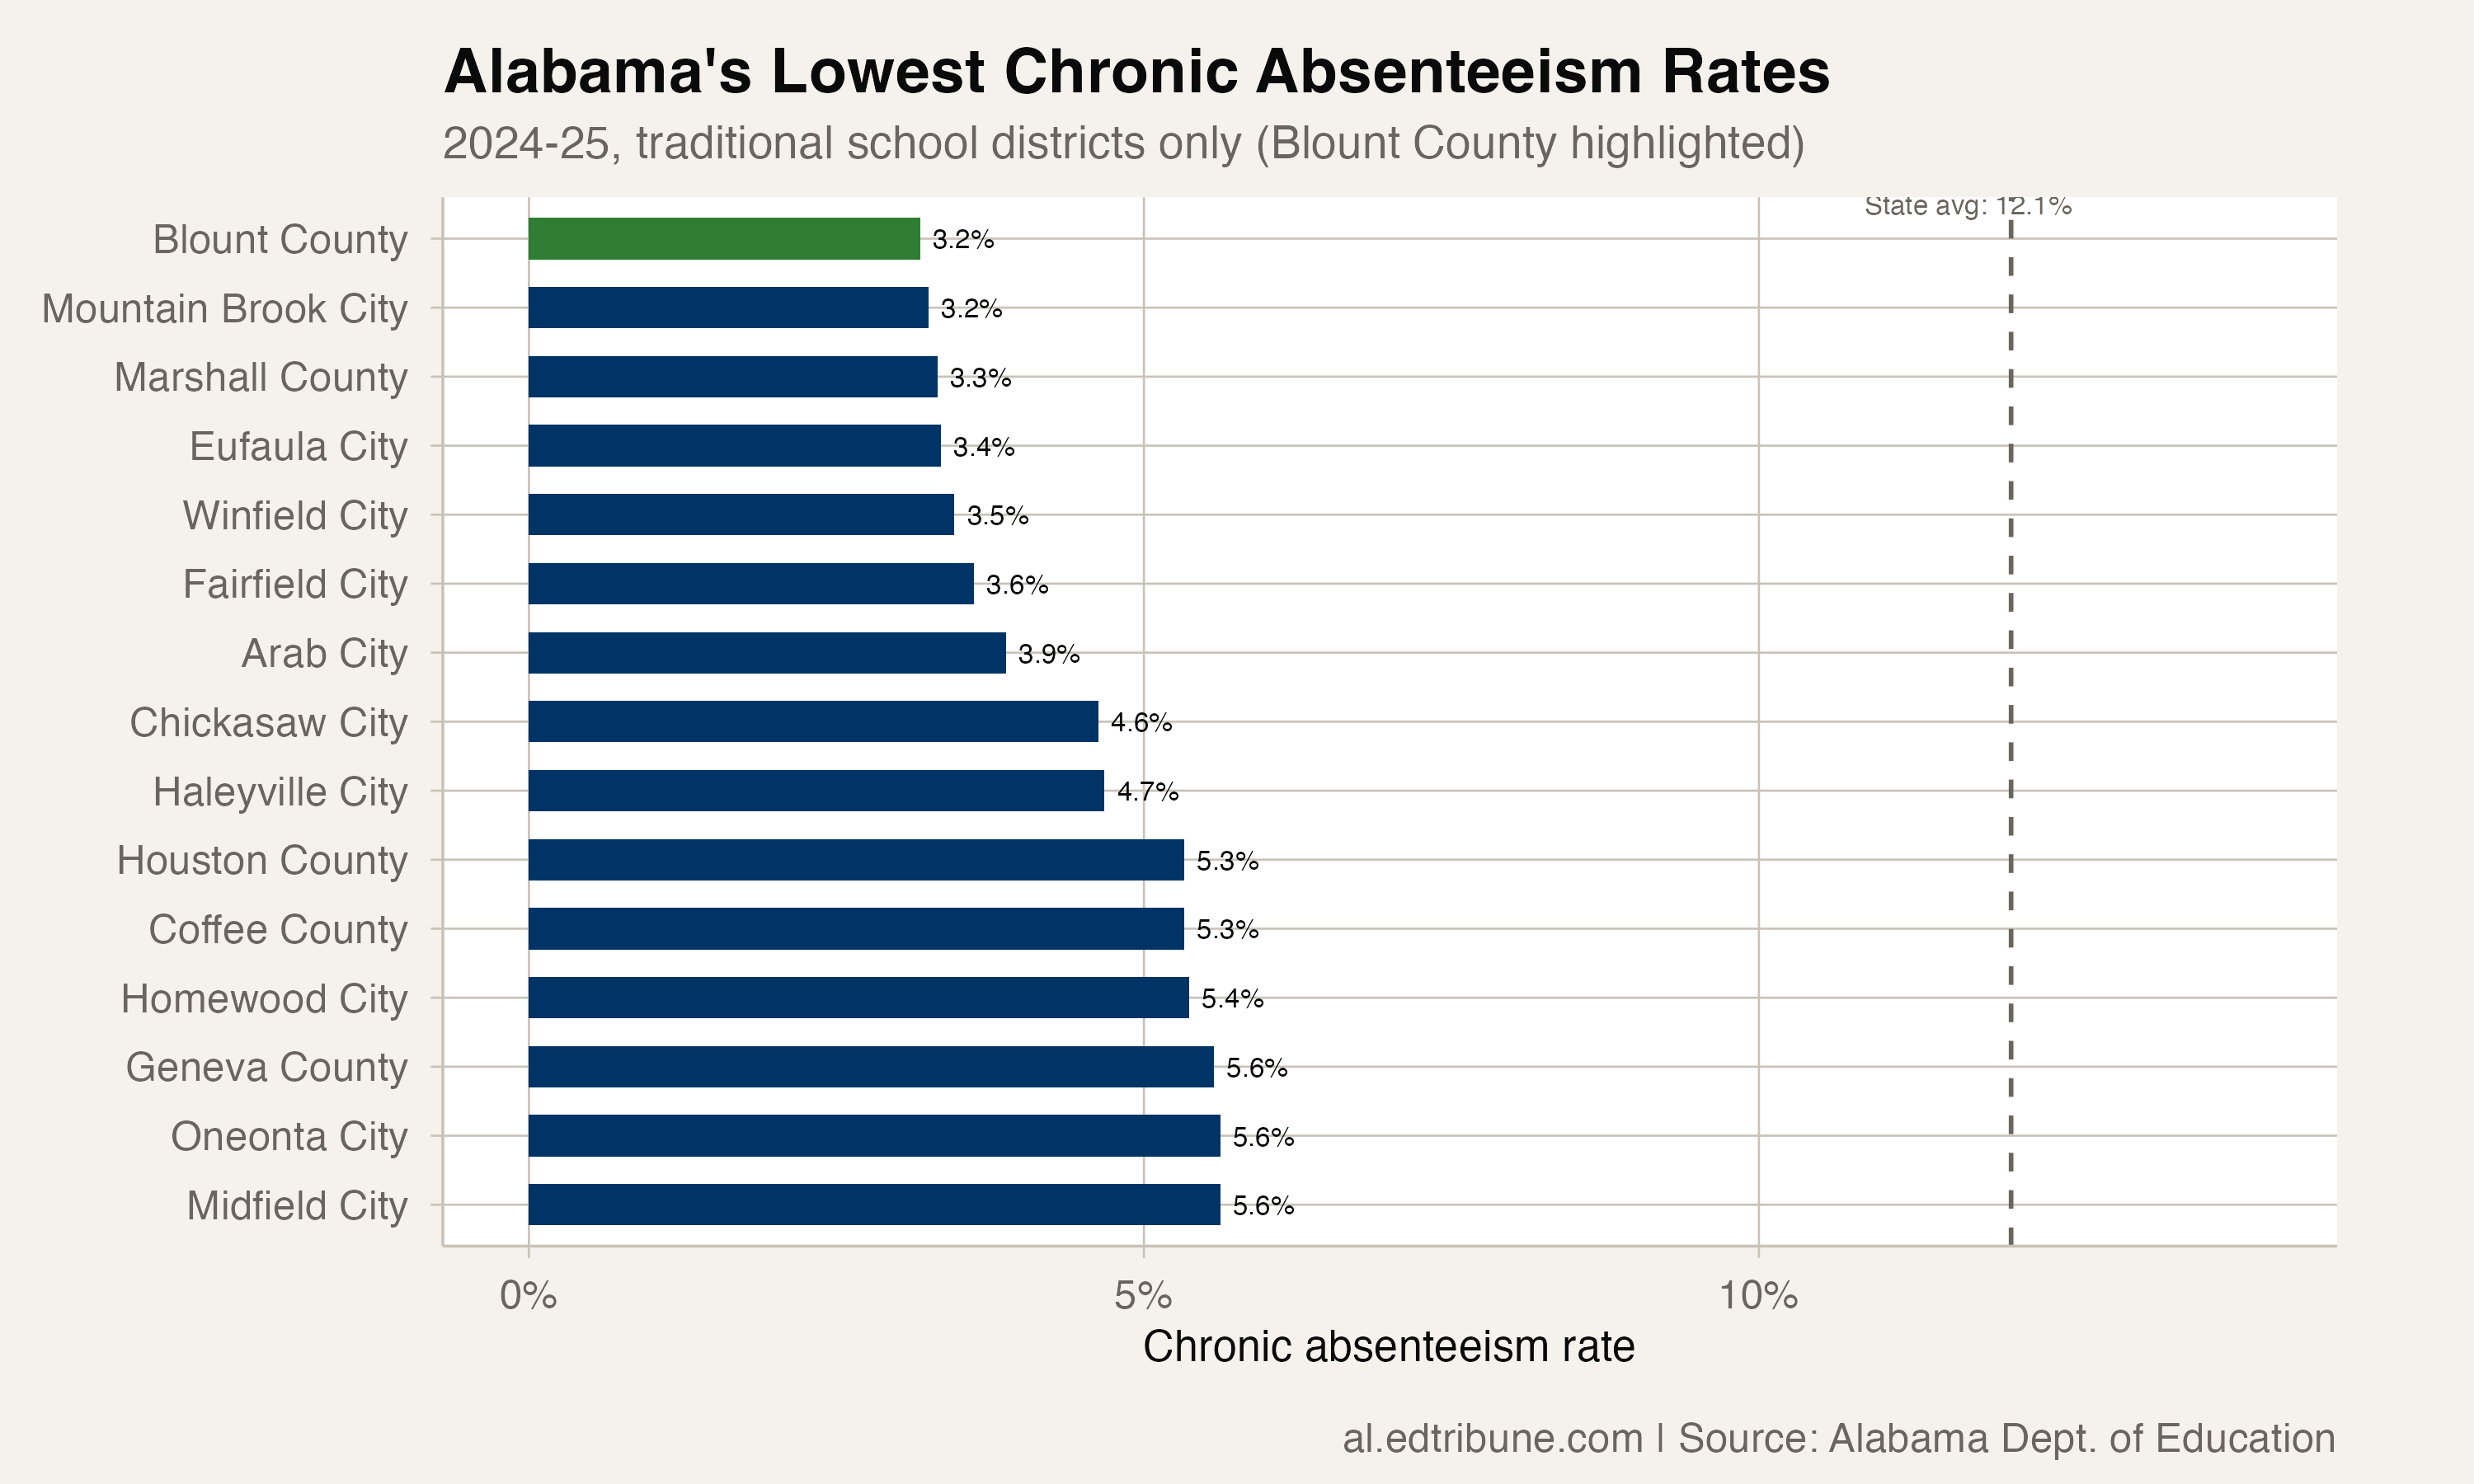
In Alabama, where 12.05% of students were chronically absent in 2024-25, Blount County's rate was 3.18%.
The North Alabama district posted the lowest chronic absenteeism rate of any traditional school district in the state. The rate is an outcome reported in the Alabama State Department of Education's attendance data; that data does not identify which local practices produced it.
Blount County has been below the statewide average in every year Alabama has released chronic absenteeism data, starting in 2017-18. Not most years. Every year. Seven for seven. (The state published no 2019-20 file, so seven released years span eight school years.)
A model of consistency
What sets Blount County apart is not a single exceptional year but sustained performance across conditions that ranged from normal to catastrophic.
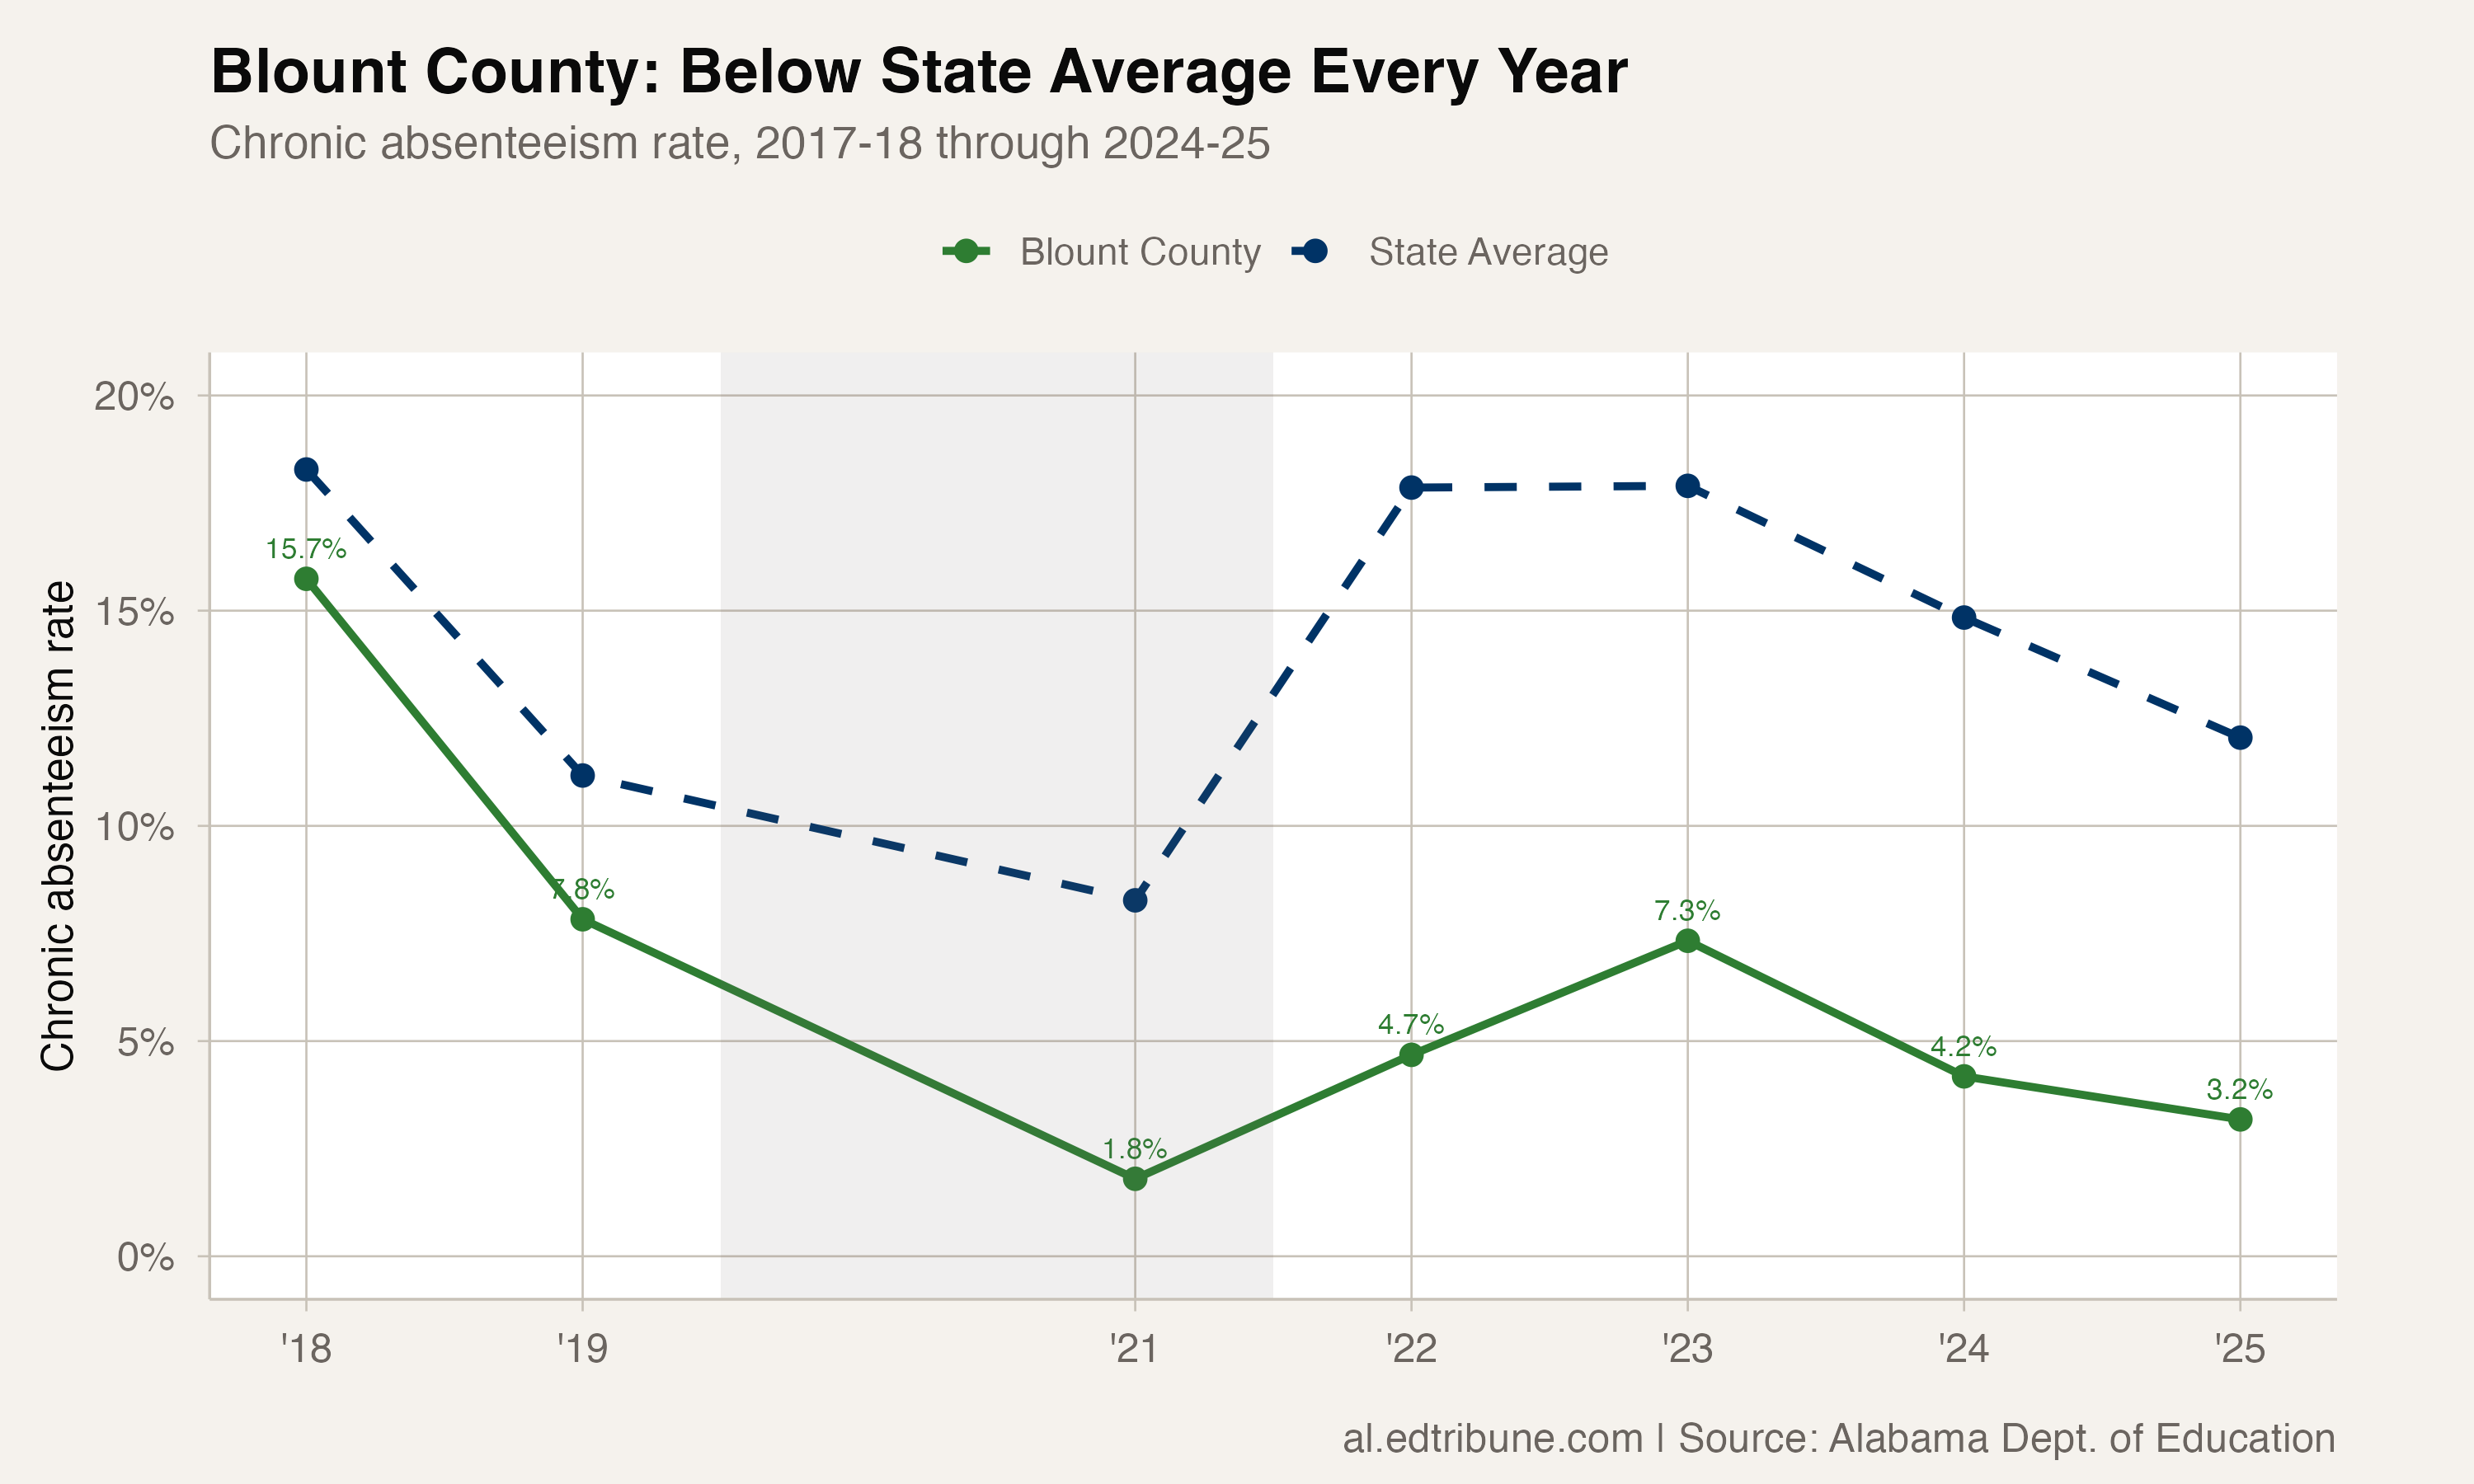
At its pandemic-era worst, a rate of 7.33% in 2022-23, Blount County was still well below the state average of 17.90%. Its highest figure in any released year is 15.74%, from 2017-18, and even that sat under the state's 18.28% that year.
The trajectory since the 2022-23 peak has been sharp: 7.33% to 4.18% to 3.18%, two consecutive years of improvement. That 3.18% is the district's lowest figure in any year except 2020-21, when Blount recorded 1.80% and the statewide rate fell to 8.27%.
What the district points to
Superintendent Rodney Green answered questions from The ALEdTribune in writing. He described attendance in Blount County as a long-standing habit rather than a recent program. "A culture that values good attendance has been cultivated in Blount County," Green wrote, crediting "the collective efforts of our schools, families, and community agencies."
Much of what he described is about how fast a family hears that a child is missing. "We have worked intentionally to improve communication with parents and families so that they are promptly informed of student absences and can work with schools to address attendance concerns," Green wrote. He said the district has also expanded student support services, "including additional nursing and mental health support, to address the needs of the whole child," and pointed to a partnership with the Helping Families Initiative, which he said provides "additional resources and support to help remove barriers that may impact student attendance, engagement, and success."
Green also said that part of what moved the reported figures was a change in how absences were written down. "Following the pandemic, we noticed a slight increase in our reported student absence rates," he wrote. "Through a careful analysis of our attendance data, we discovered that some tardies were inadvertently being coded as full-day absences." The district brought in Alabama State Department of Education PowerSchool coaches, who he said trained its student information system specialists and front desk staff so that "attendance codes were entered consistently and accurately." In his words, "This process has helped us improve the reliability of our attendance data and better identify students who may need additional support."
That account bears on how the drop from 7.33% to 3.18% should be read. The state's figures record what districts report, and a district that stops counting a tardy as a full-day absence lowers its reported rate whether or not any student's attendance changed. Neither the published data nor the district's account separates the part of the decline that came from cleaner coding from the part that came from students being in school more.
Strong attendance across subgroups
The subgroup data shows strong attendance across every subgroup Alabama published for the district in 2024-25:
- English learners: 1.18%
- Black students: 1.70%
- Hispanic students: 1.83%
- All students: 3.18%
- White students: 3.46%
- Economically disadvantaged: 4.06%
- Special education: 5.26%
- Multiracial students: 5.97%
Even the highest-rate subgroup, multiracial students at 5.97%, sits below half the statewide all-student rate of 12.05%. English learners had the lowest rate among Blount County's published subgroups, at 1.18%.
Green said the district has focused on its subgroups, attendance and achievement together, and he tied that work to the English learner figure. "We believe this intentional focus has had a positive impact on our English Learners and their academic progress," he wrote. He also pointed to the Blount County students recognized this year with the Alabama Seal of Biliteracy.
Among the best, the best
Twenty-seven Alabama districts have been below the state chronic absenteeism average in all seven years of available data. Blount County leads this group with the lowest 2025 rate.
The districts Blount County↗ET keeps in this consistency category are instructive. Mountain Brook City↗ET (3.25%), Marshall County↗ET (3.32%), and Winfield City (3.46%) are among the next-lowest rates. The list includes suburban districts like Vestavia Hills (5.75%) and Homewood (5.37%), but also smaller towns like Piedmont (6.45%) and Athens (7.71%).
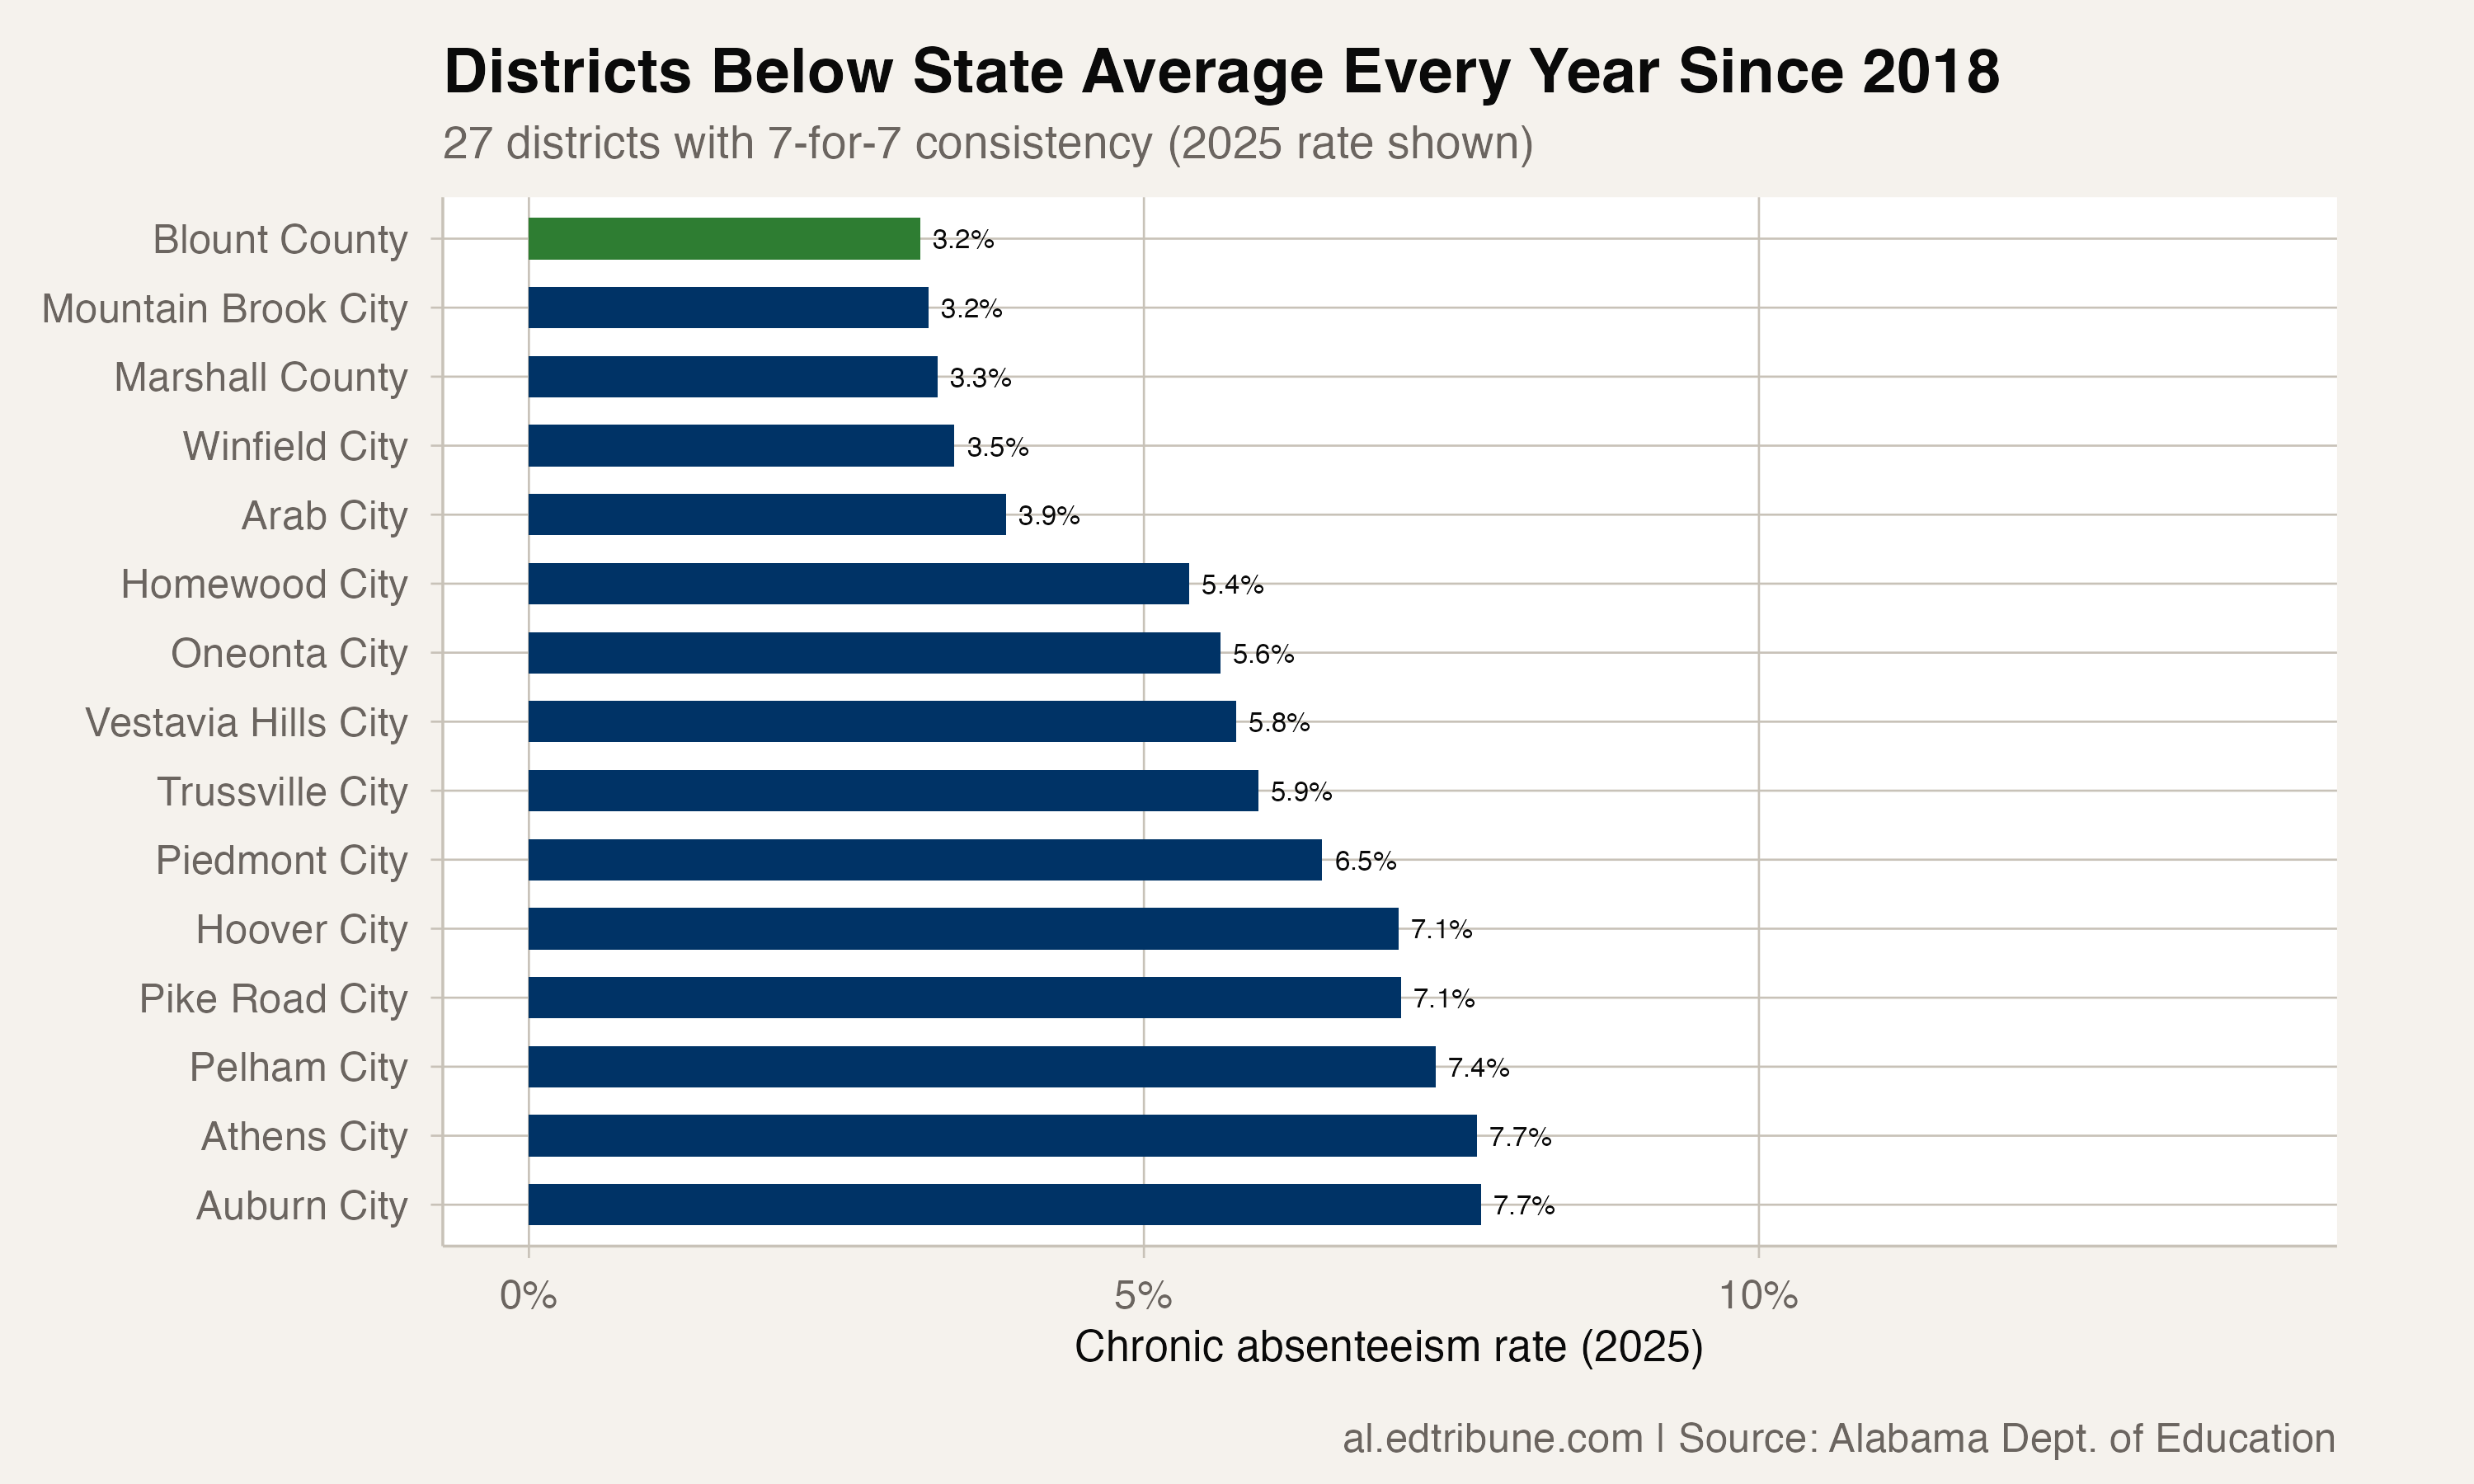
Blount County is a rural county in the foothills of the Appalachian Mountains, north of Birmingham. The comparison is useful because the state's reported figures show the attendance outcome across districts with different sizes and contexts, but they do not establish why the rates differ.
What does 3.18% look like?
The published 3.18% rate applied to Blount County's 7,207-student enrollment produces a computed proxy of about 229 students. Because the rate is rounded, that is an estimate rather than a reported headcount.
This is the advantage of Blount County's rate: the number of students needing attention is small enough for a district to examine individual barriers. The state's reported figures do not show whether that kind of individual attention is happening. Green's written account describes it, in the form of a prompt call home and a route to a community partner, and the published data can neither confirm nor contradict him.
The state's data cannot identify what Blount County is doing differently, and the district's own account of the work is not testable against it. What the data does show is the outcome: Blount had the lowest rate among traditional districts in 2024-25 and was one of 27 districts below the state average in every released year. It ranked 47th of 137 traditional districts in the first 2017-18 file, so the current lead reflects a recent position within a longer record of above-average attendance.
Detailed code that reproduces the analysis and figures in this article is available exclusively to EdTribune subscribers.
Discussion
Sign in to join the discussion.
Loading comments...