Correction: An earlier draft incorrectly said the White chronic-absence rate recovered faster than the Black rate after 2022 and included district, raw-student, and causal claims the available data cannot support.
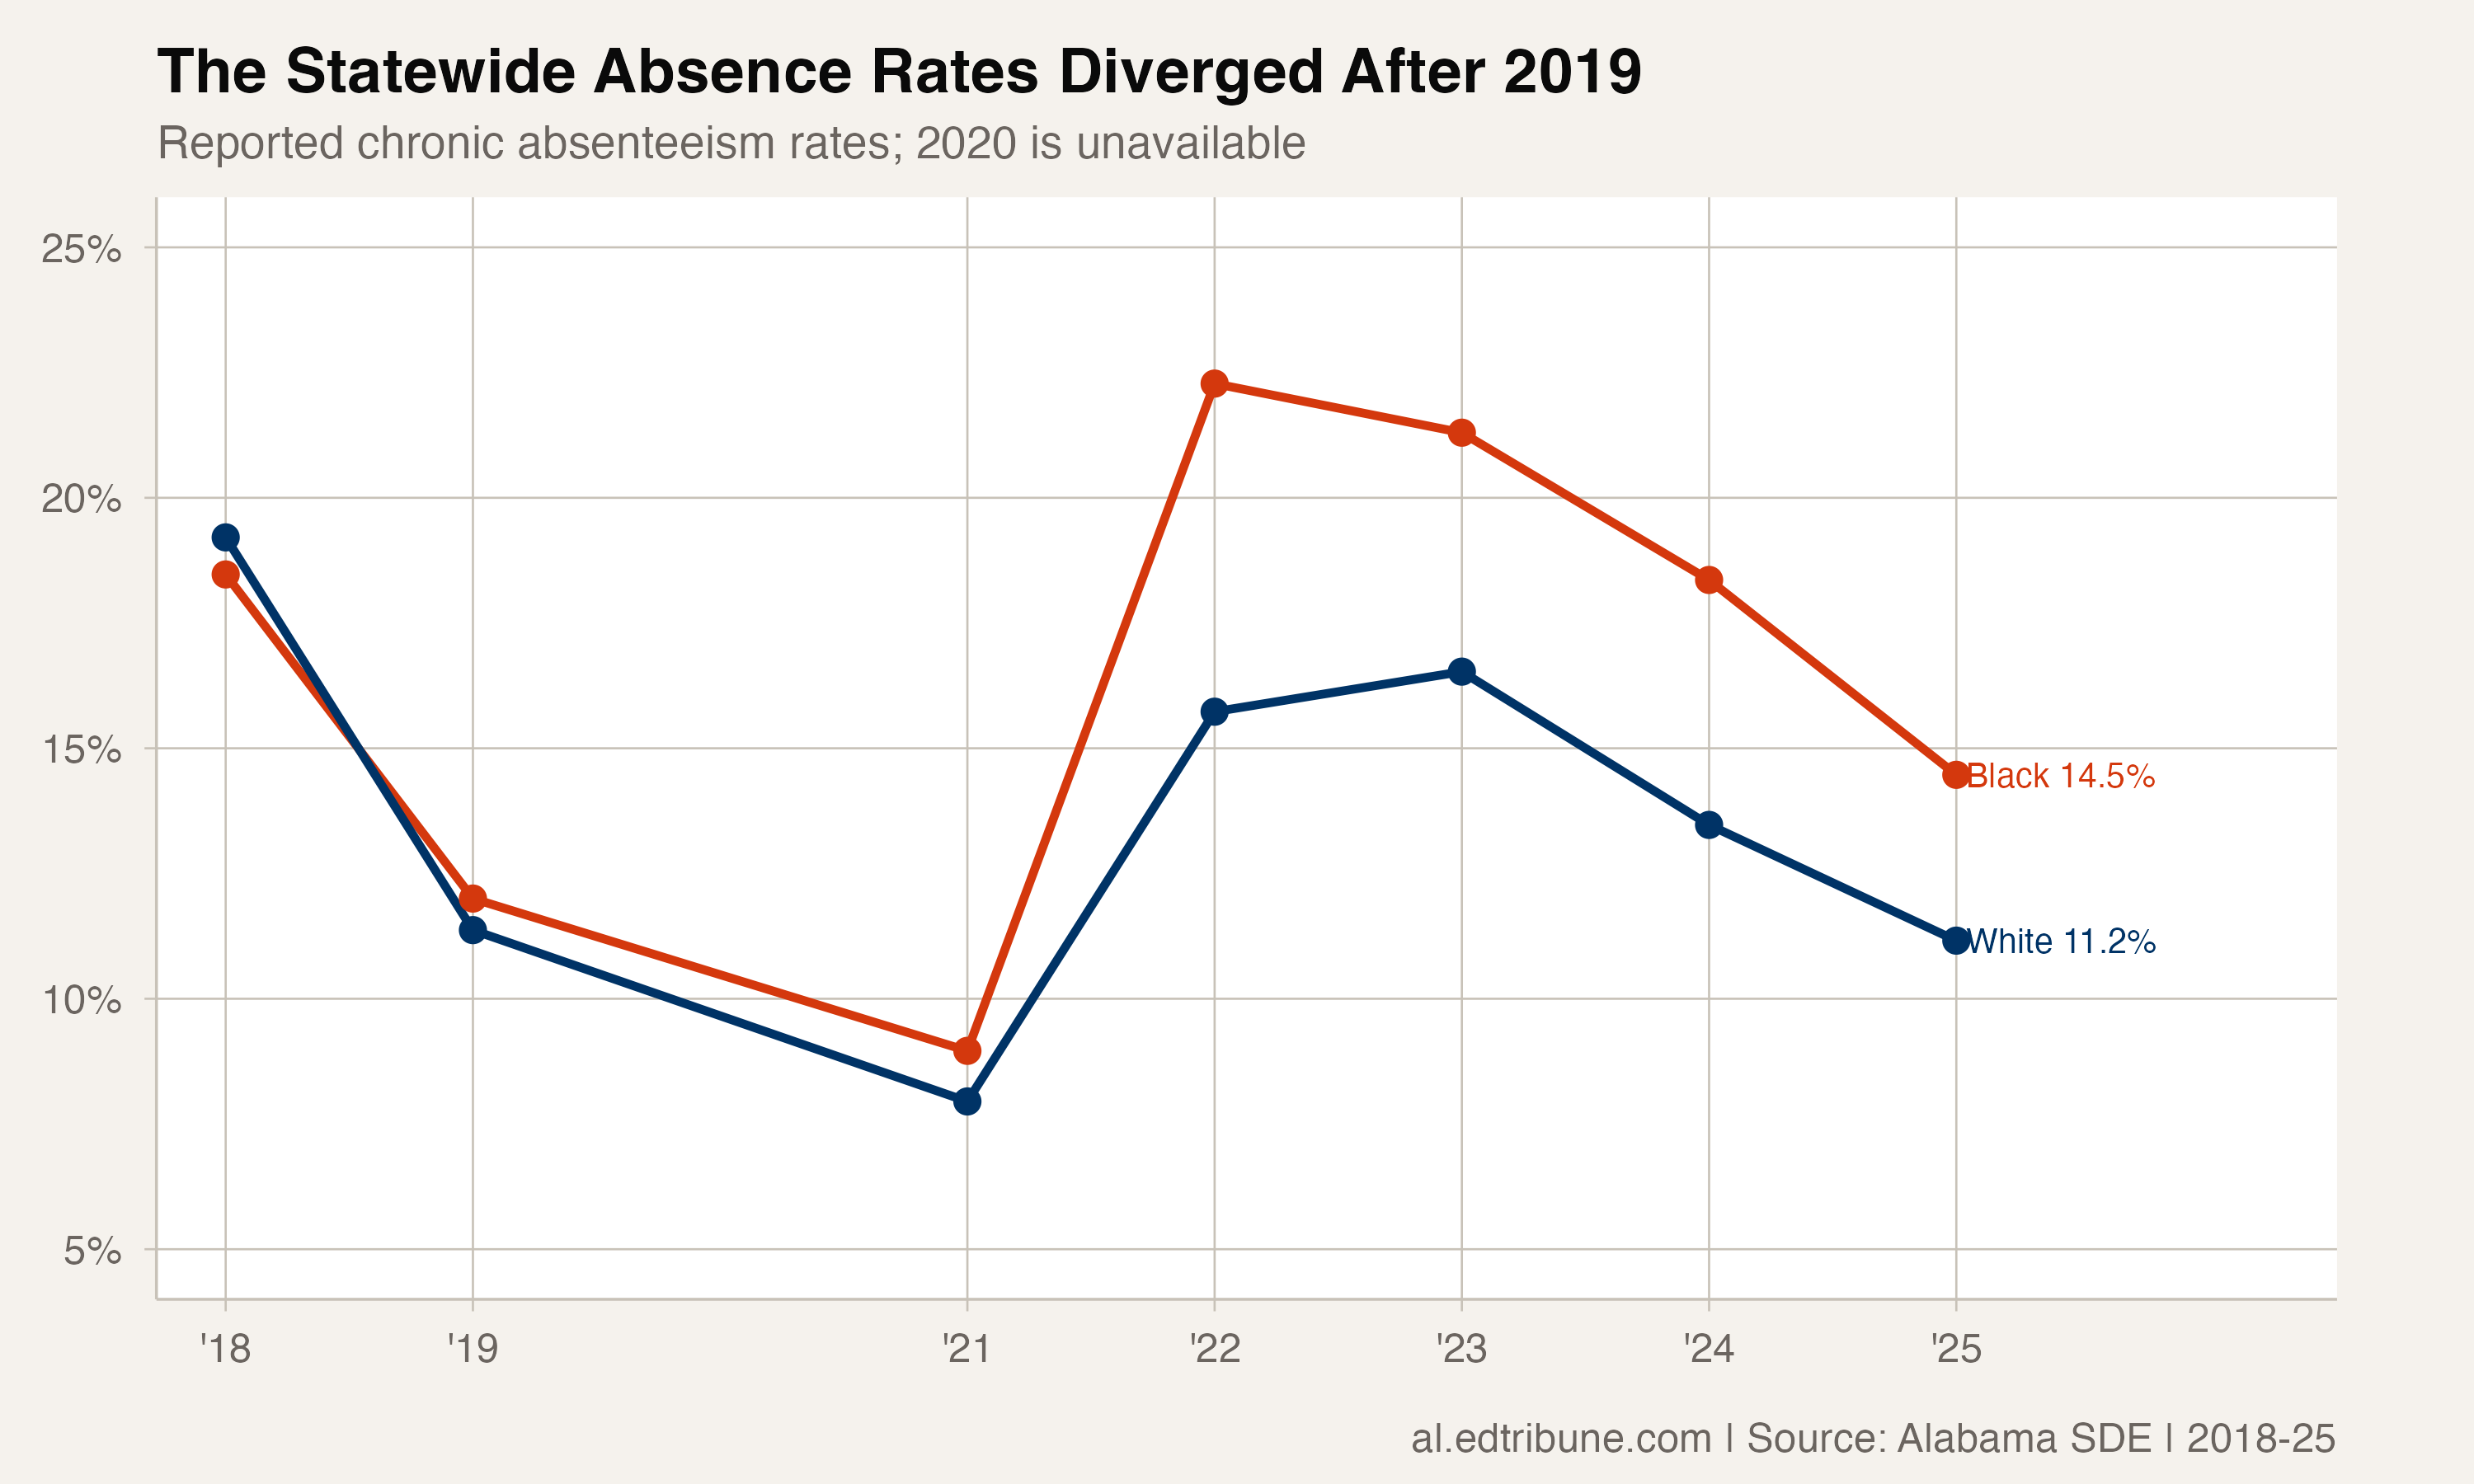
Alabama's statewide chronic absenteeism rate for Black students was 12.00% in 2019, compared with 11.37% for White students. The 0.63-percentage-point gap was small.
In 2025, the Black rate was 14.47% and the White rate was 11.16%. The 3.31-point gap was 2.68 points wider and 5.3 times as large as the 2019 gap.
The multiplier needs context: it is large partly because the 2019 denominator was a gap of less than one percentage point.
The full reported path
The state data include statewide rates for 2018, 2019, and 2021 through 2025. They have no 2020 row.
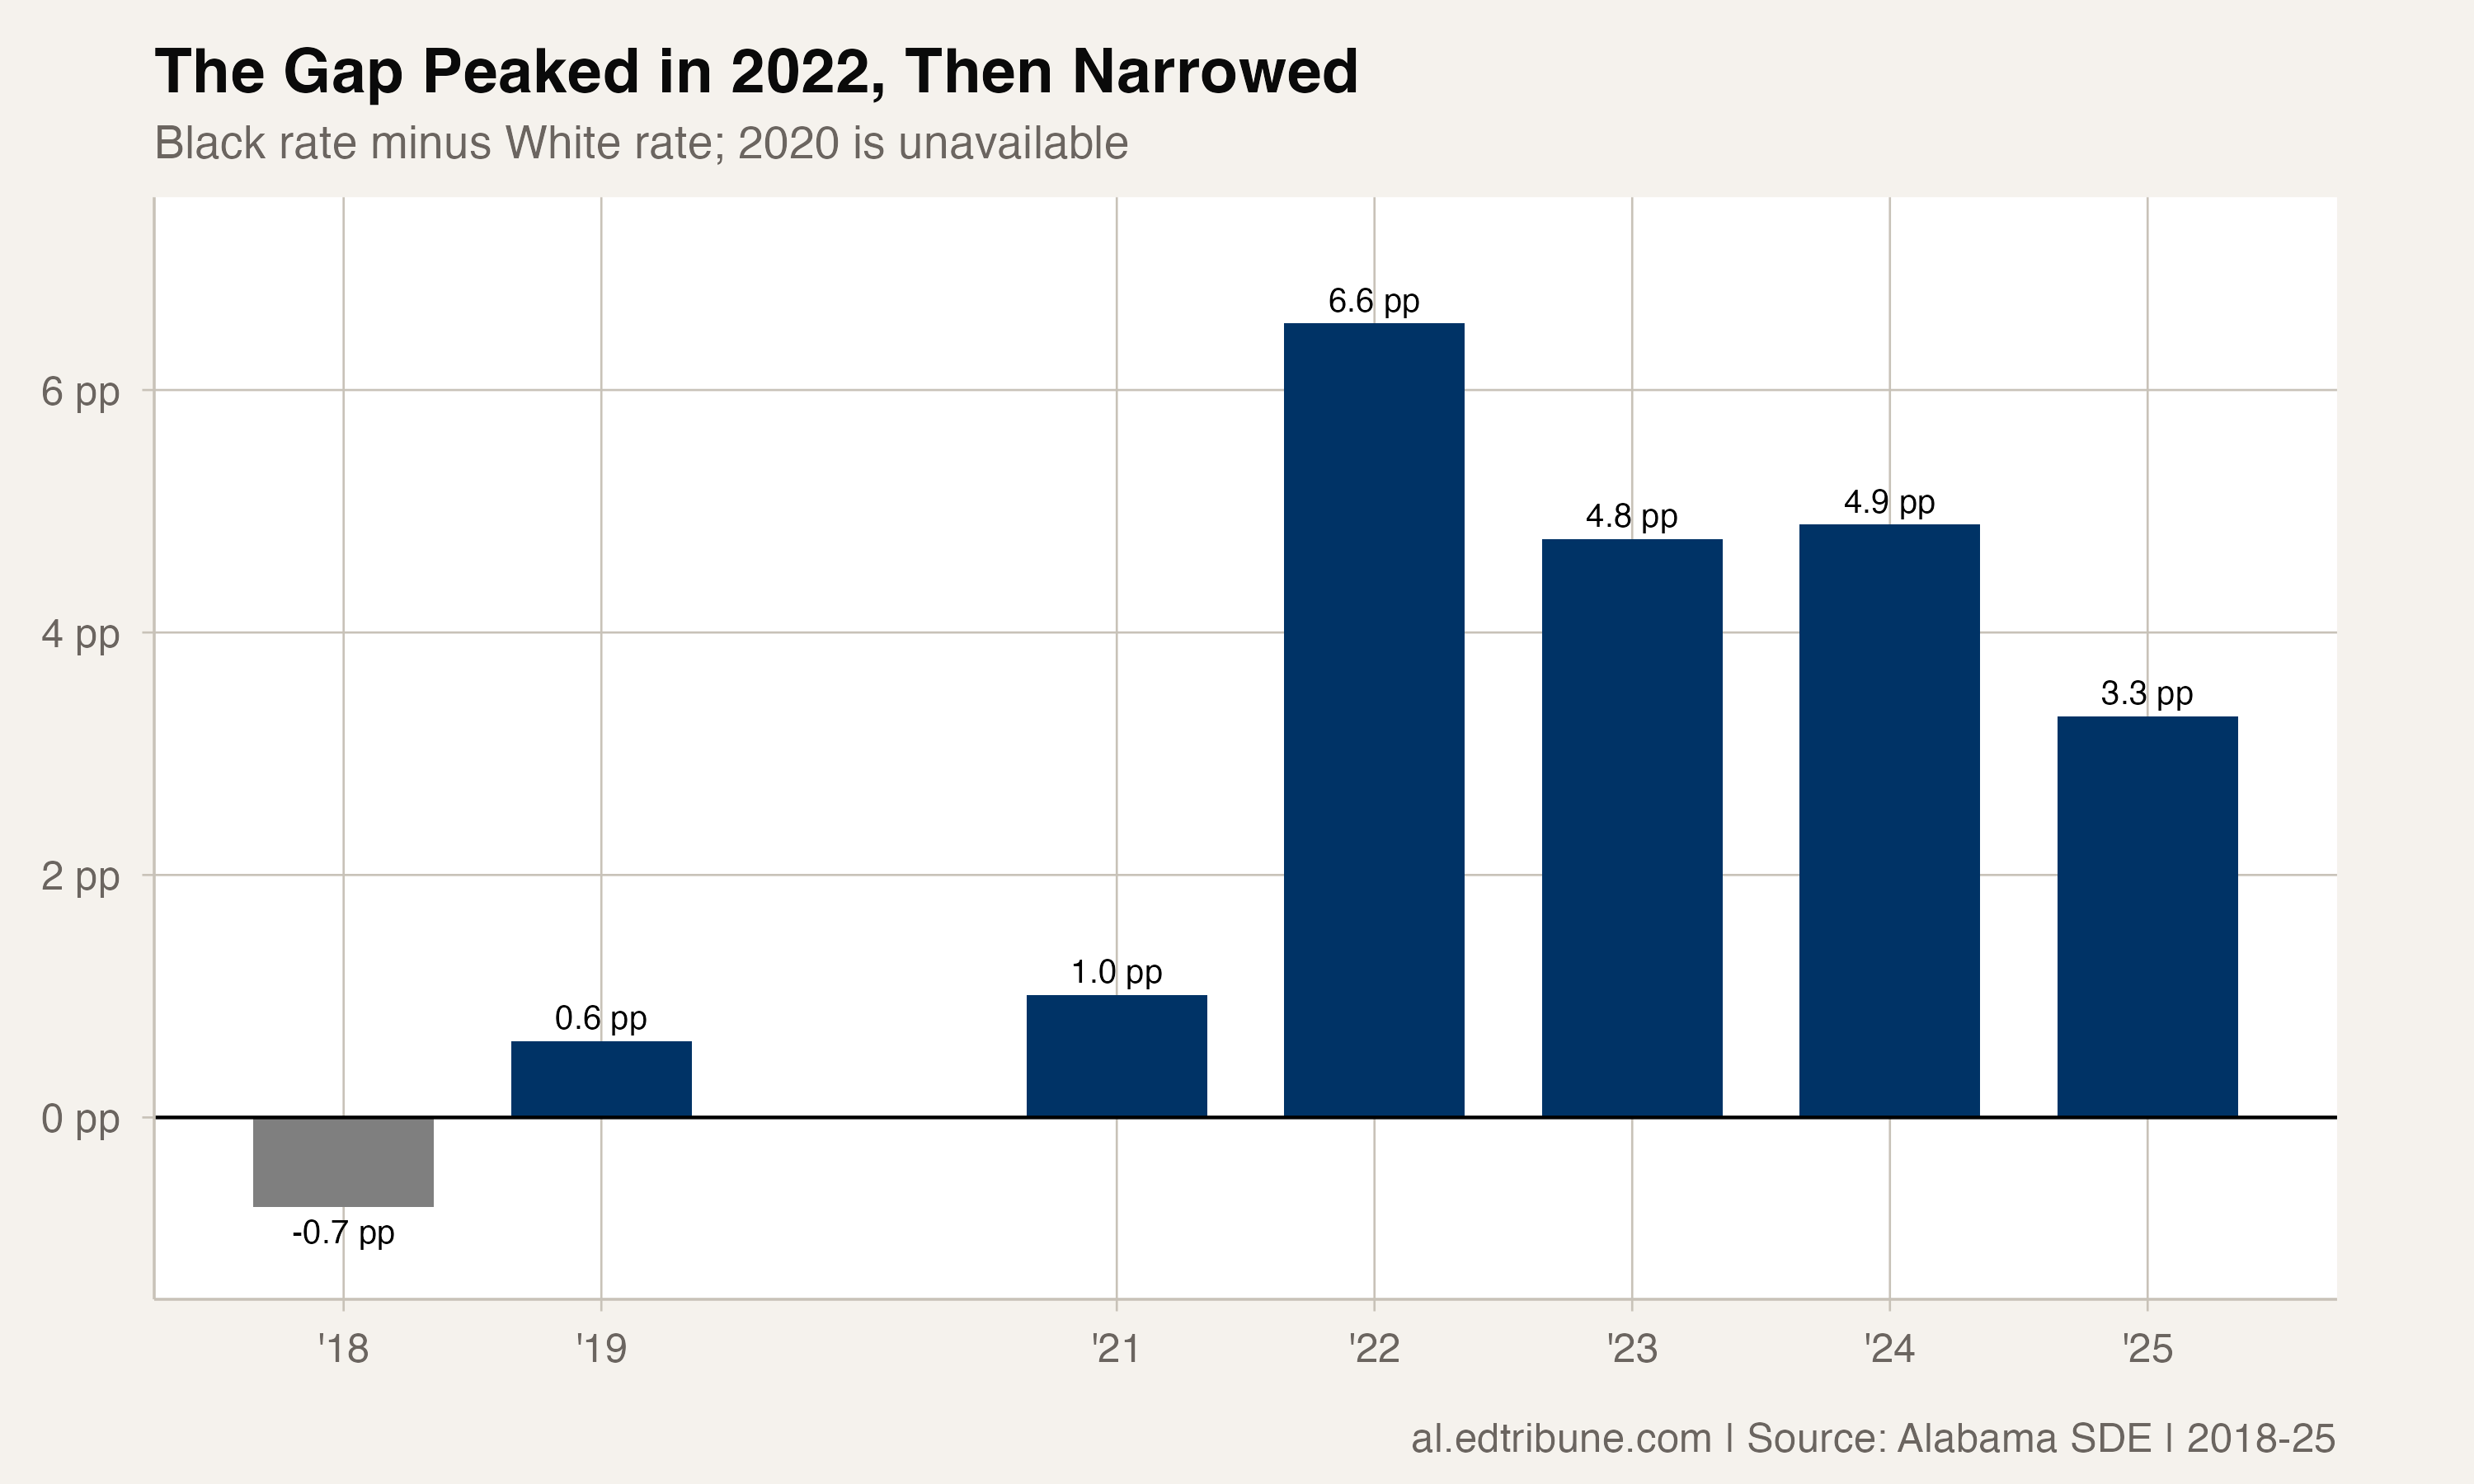
In 2018, the Black rate was 18.47% and the White rate was 19.21%, putting the Black rate 0.74 point lower. The gap then measured 0.63 point in 2019 and 1.01 points in 2021.
The gap reached 6.55 points in 2022, when the Black rate was 22.28% and the White rate was 15.73%. It narrowed to 4.77 points in 2023, widened slightly to 4.89 points in 2024, and narrowed to 3.31 points in 2025.
The 2021 rates are sharply lower than the surrounding reports. The available state records supply no verified coverage or waiver metadata, so this analysis treats 2021 as a reported discontinuity and does not use it to explain pandemic effects.
Black students improved more from 2022
From 2022 to 2025, the Black chronic-absence rate fell 7.81 points. The White rate fell 4.57 points. On that comparison, Black students improved more, and the racial gap narrowed by 3.24 points.
The baseline comparison answers a different question. Relative to 2019, the 2025 Black rate remained 2.47 points higher, while the White rate was 0.21 point lower.
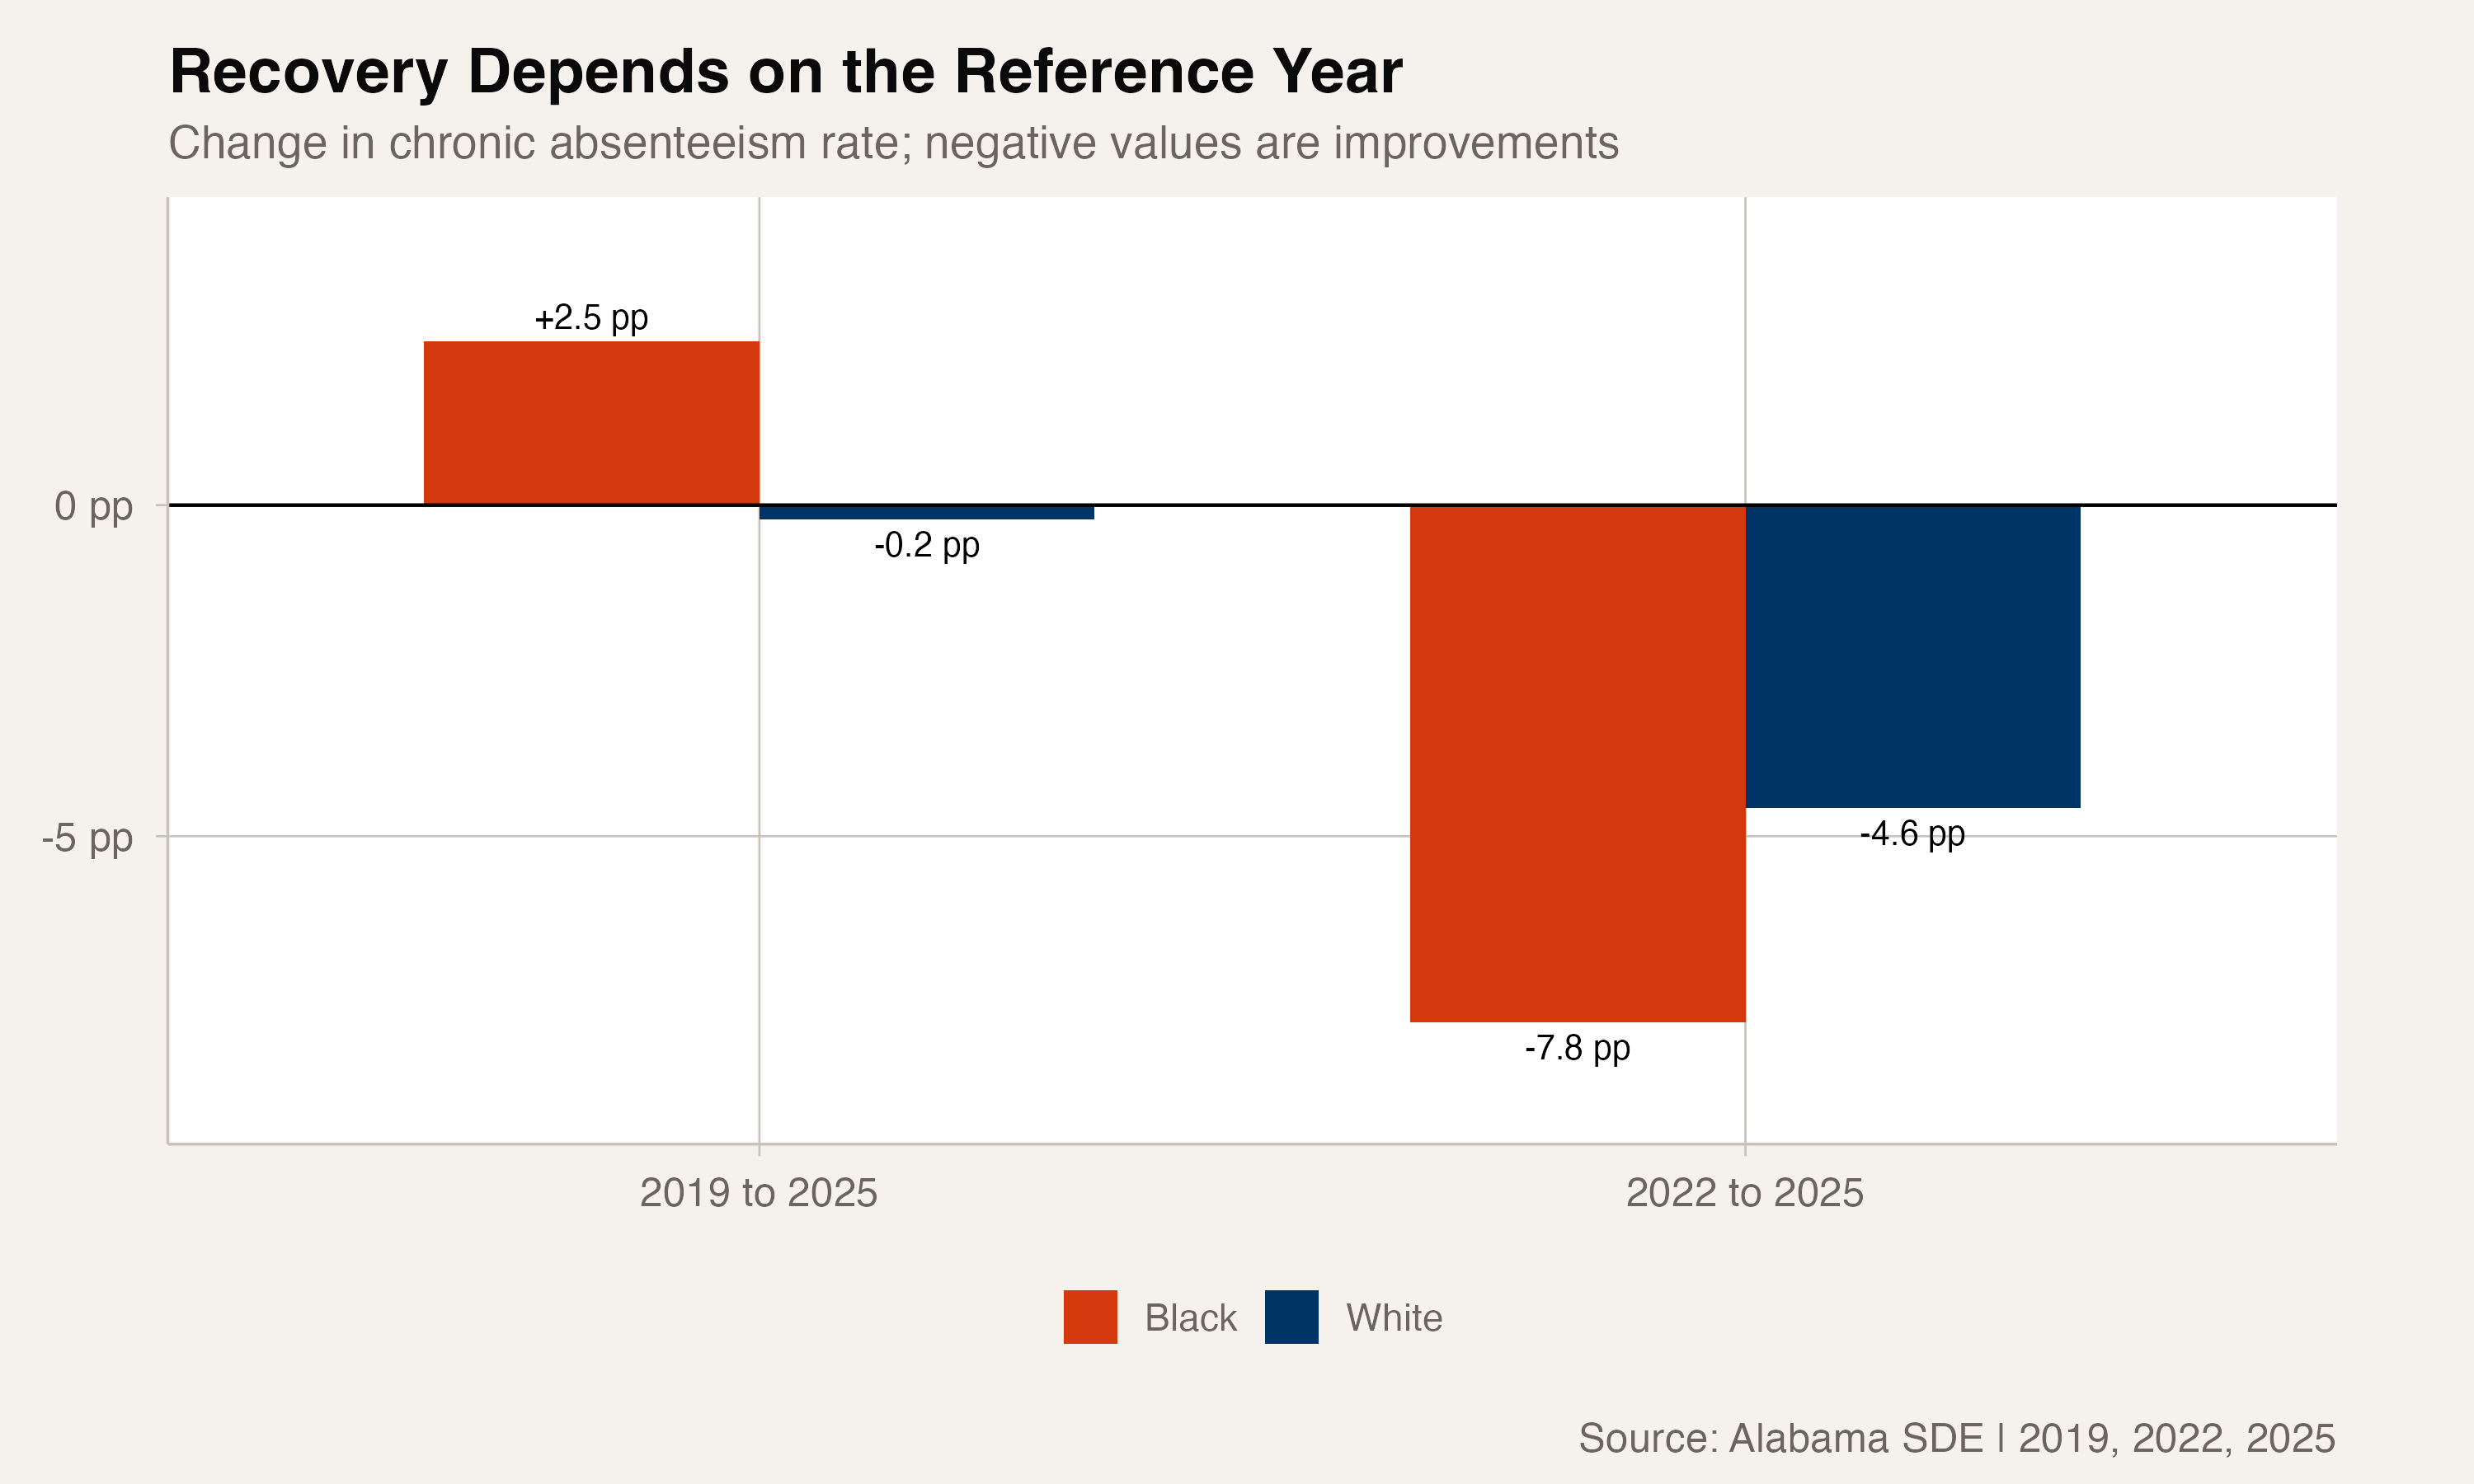
Both statements can be true: the Black rate fell farther after 2022 but still ended farther above its 2019 level.
What the data cannot support
The absence surface reports rates without enrollment or chronic-absence counts. That prevents translating the 3.31-point gap into a number of students.
It also provides no district IDs or district subgroup denominators. Exact duplicate records and a remaining district-name collision make name-based ranks unsafe. District rankings, direction counts, and Black Belt, urban, suburban, or rural comparisons are therefore excluded.
Health disparities, housing instability, transportation, economic conditions, and pandemic disruption are unresourced as explanations in this analysis. The rates establish timing and disparity, not cause. The data also do not support projecting a date when the gap might close.
Detailed code that reproduces the analysis and figures in this article is available exclusively to EdTribune subscribers.
Discussion
Sign in to join the discussion.
Loading comments...