In this series: Alabama 2025-26 Enrollment.
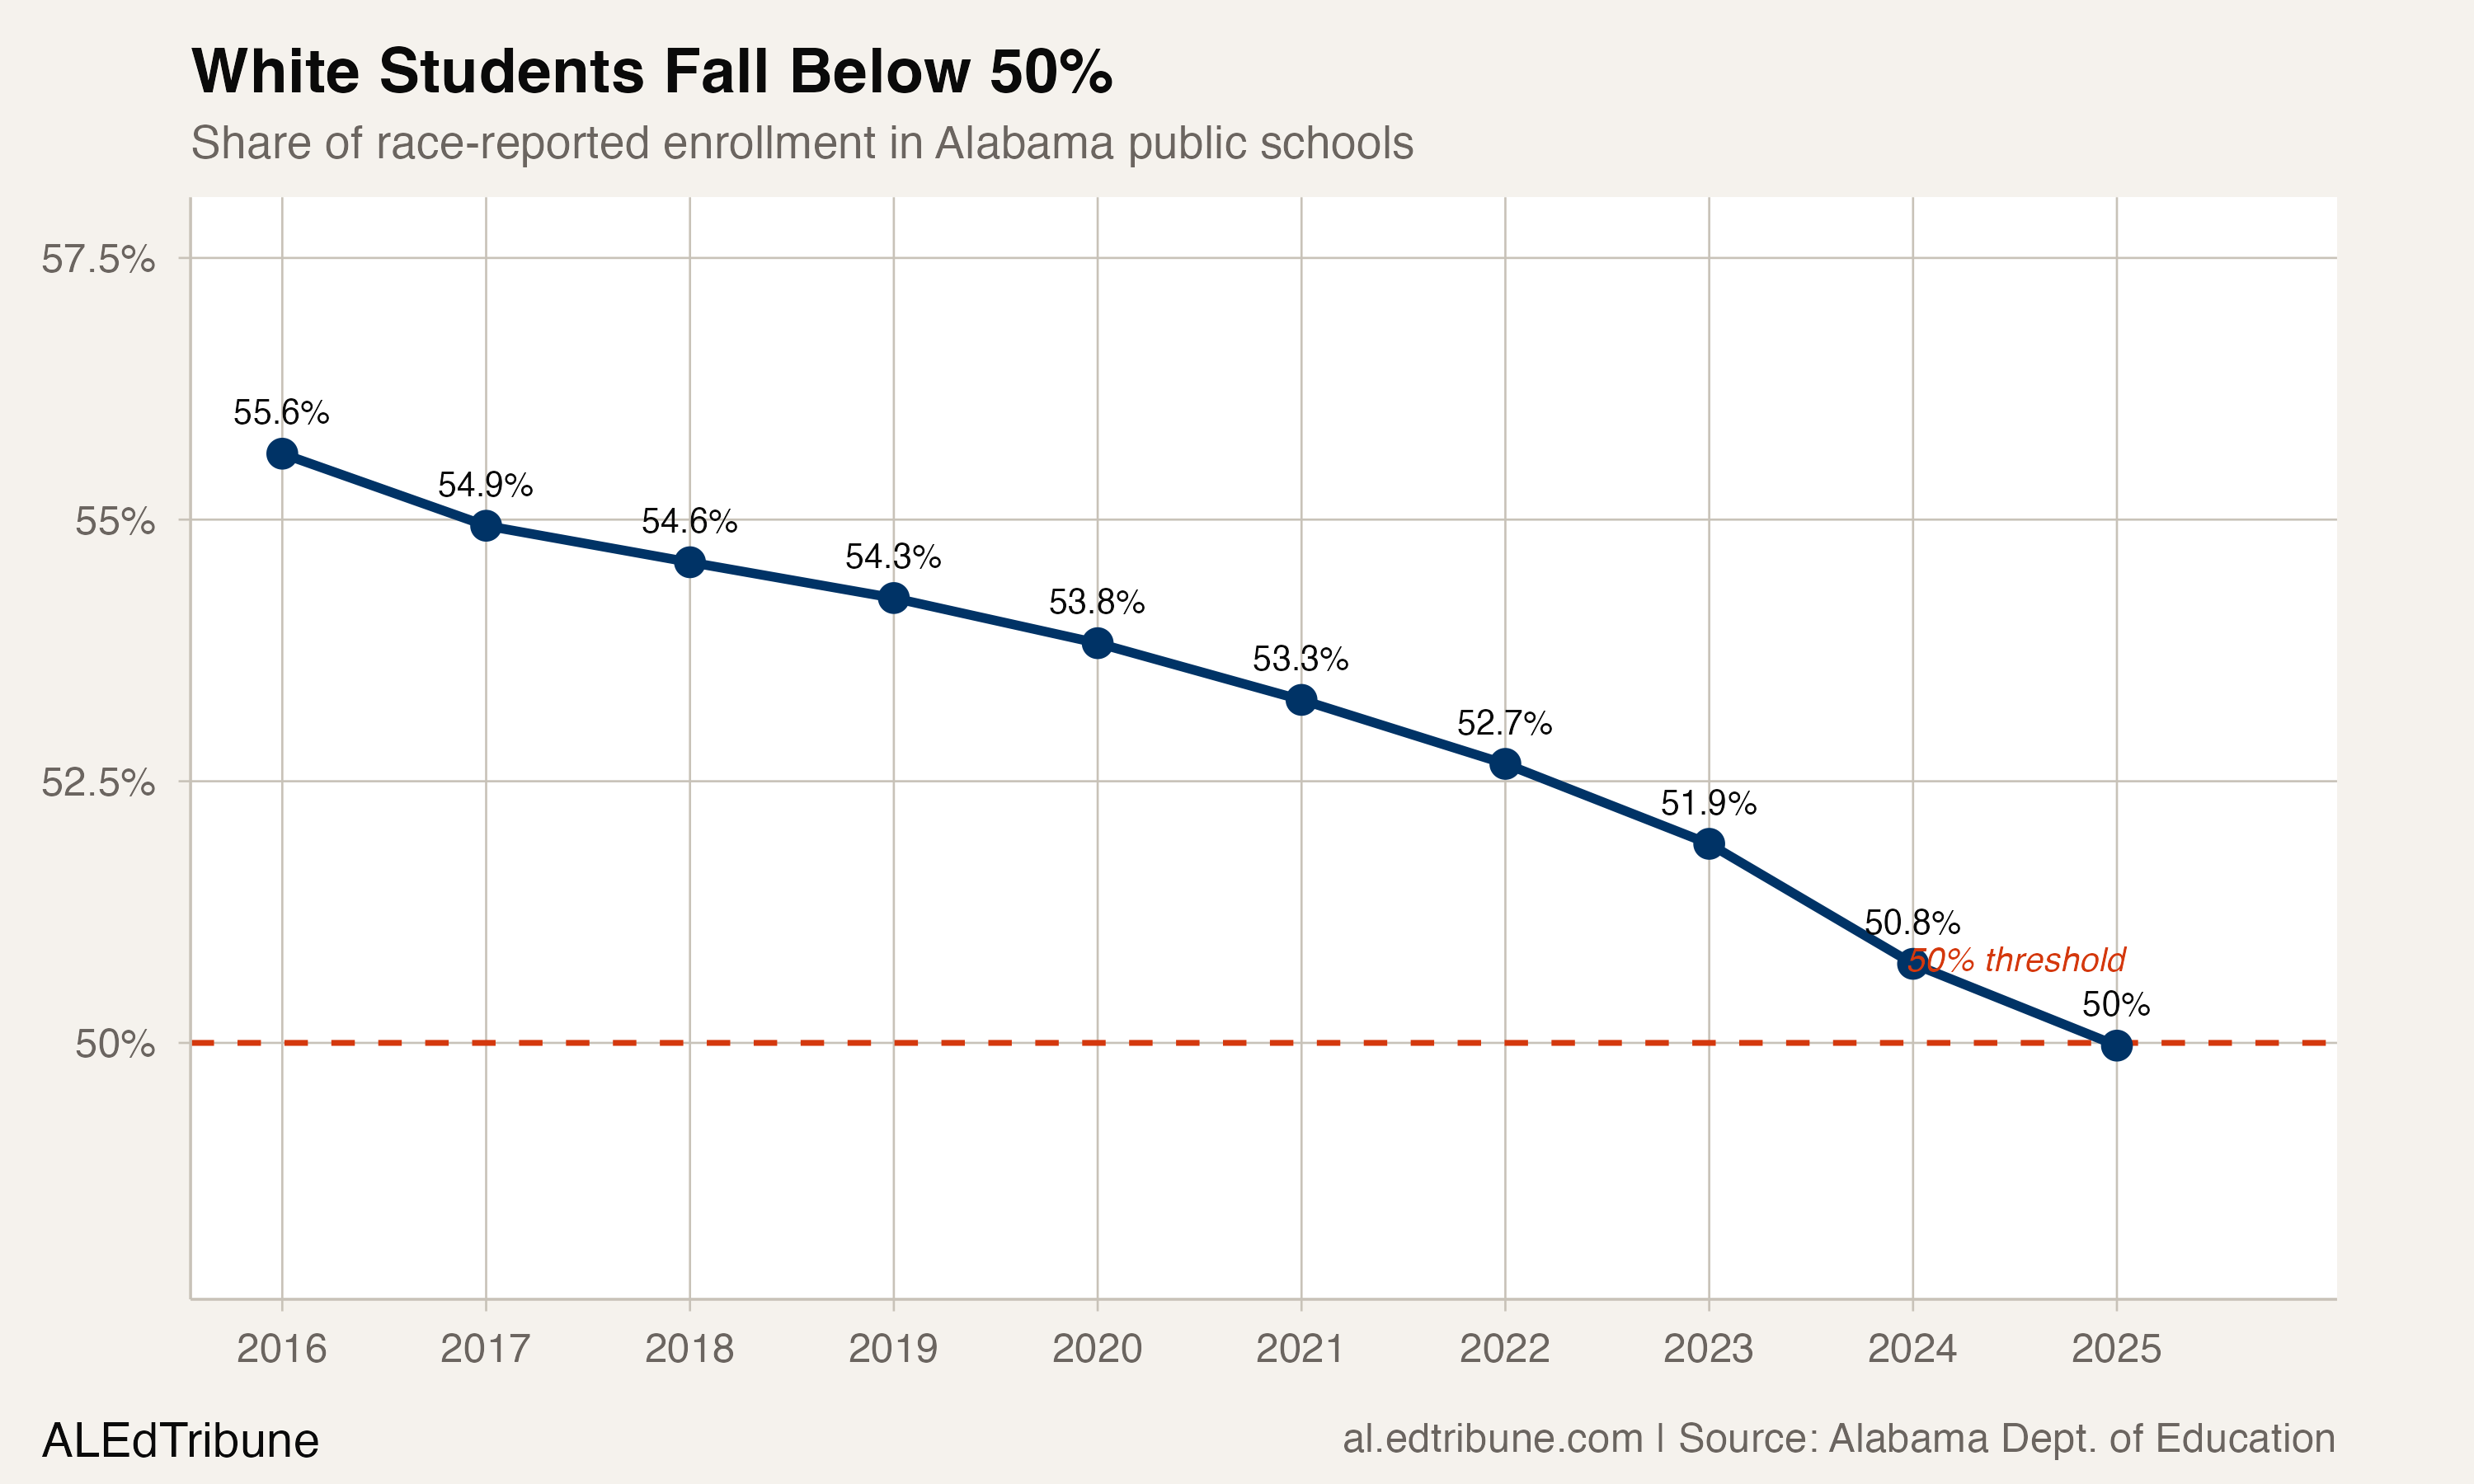
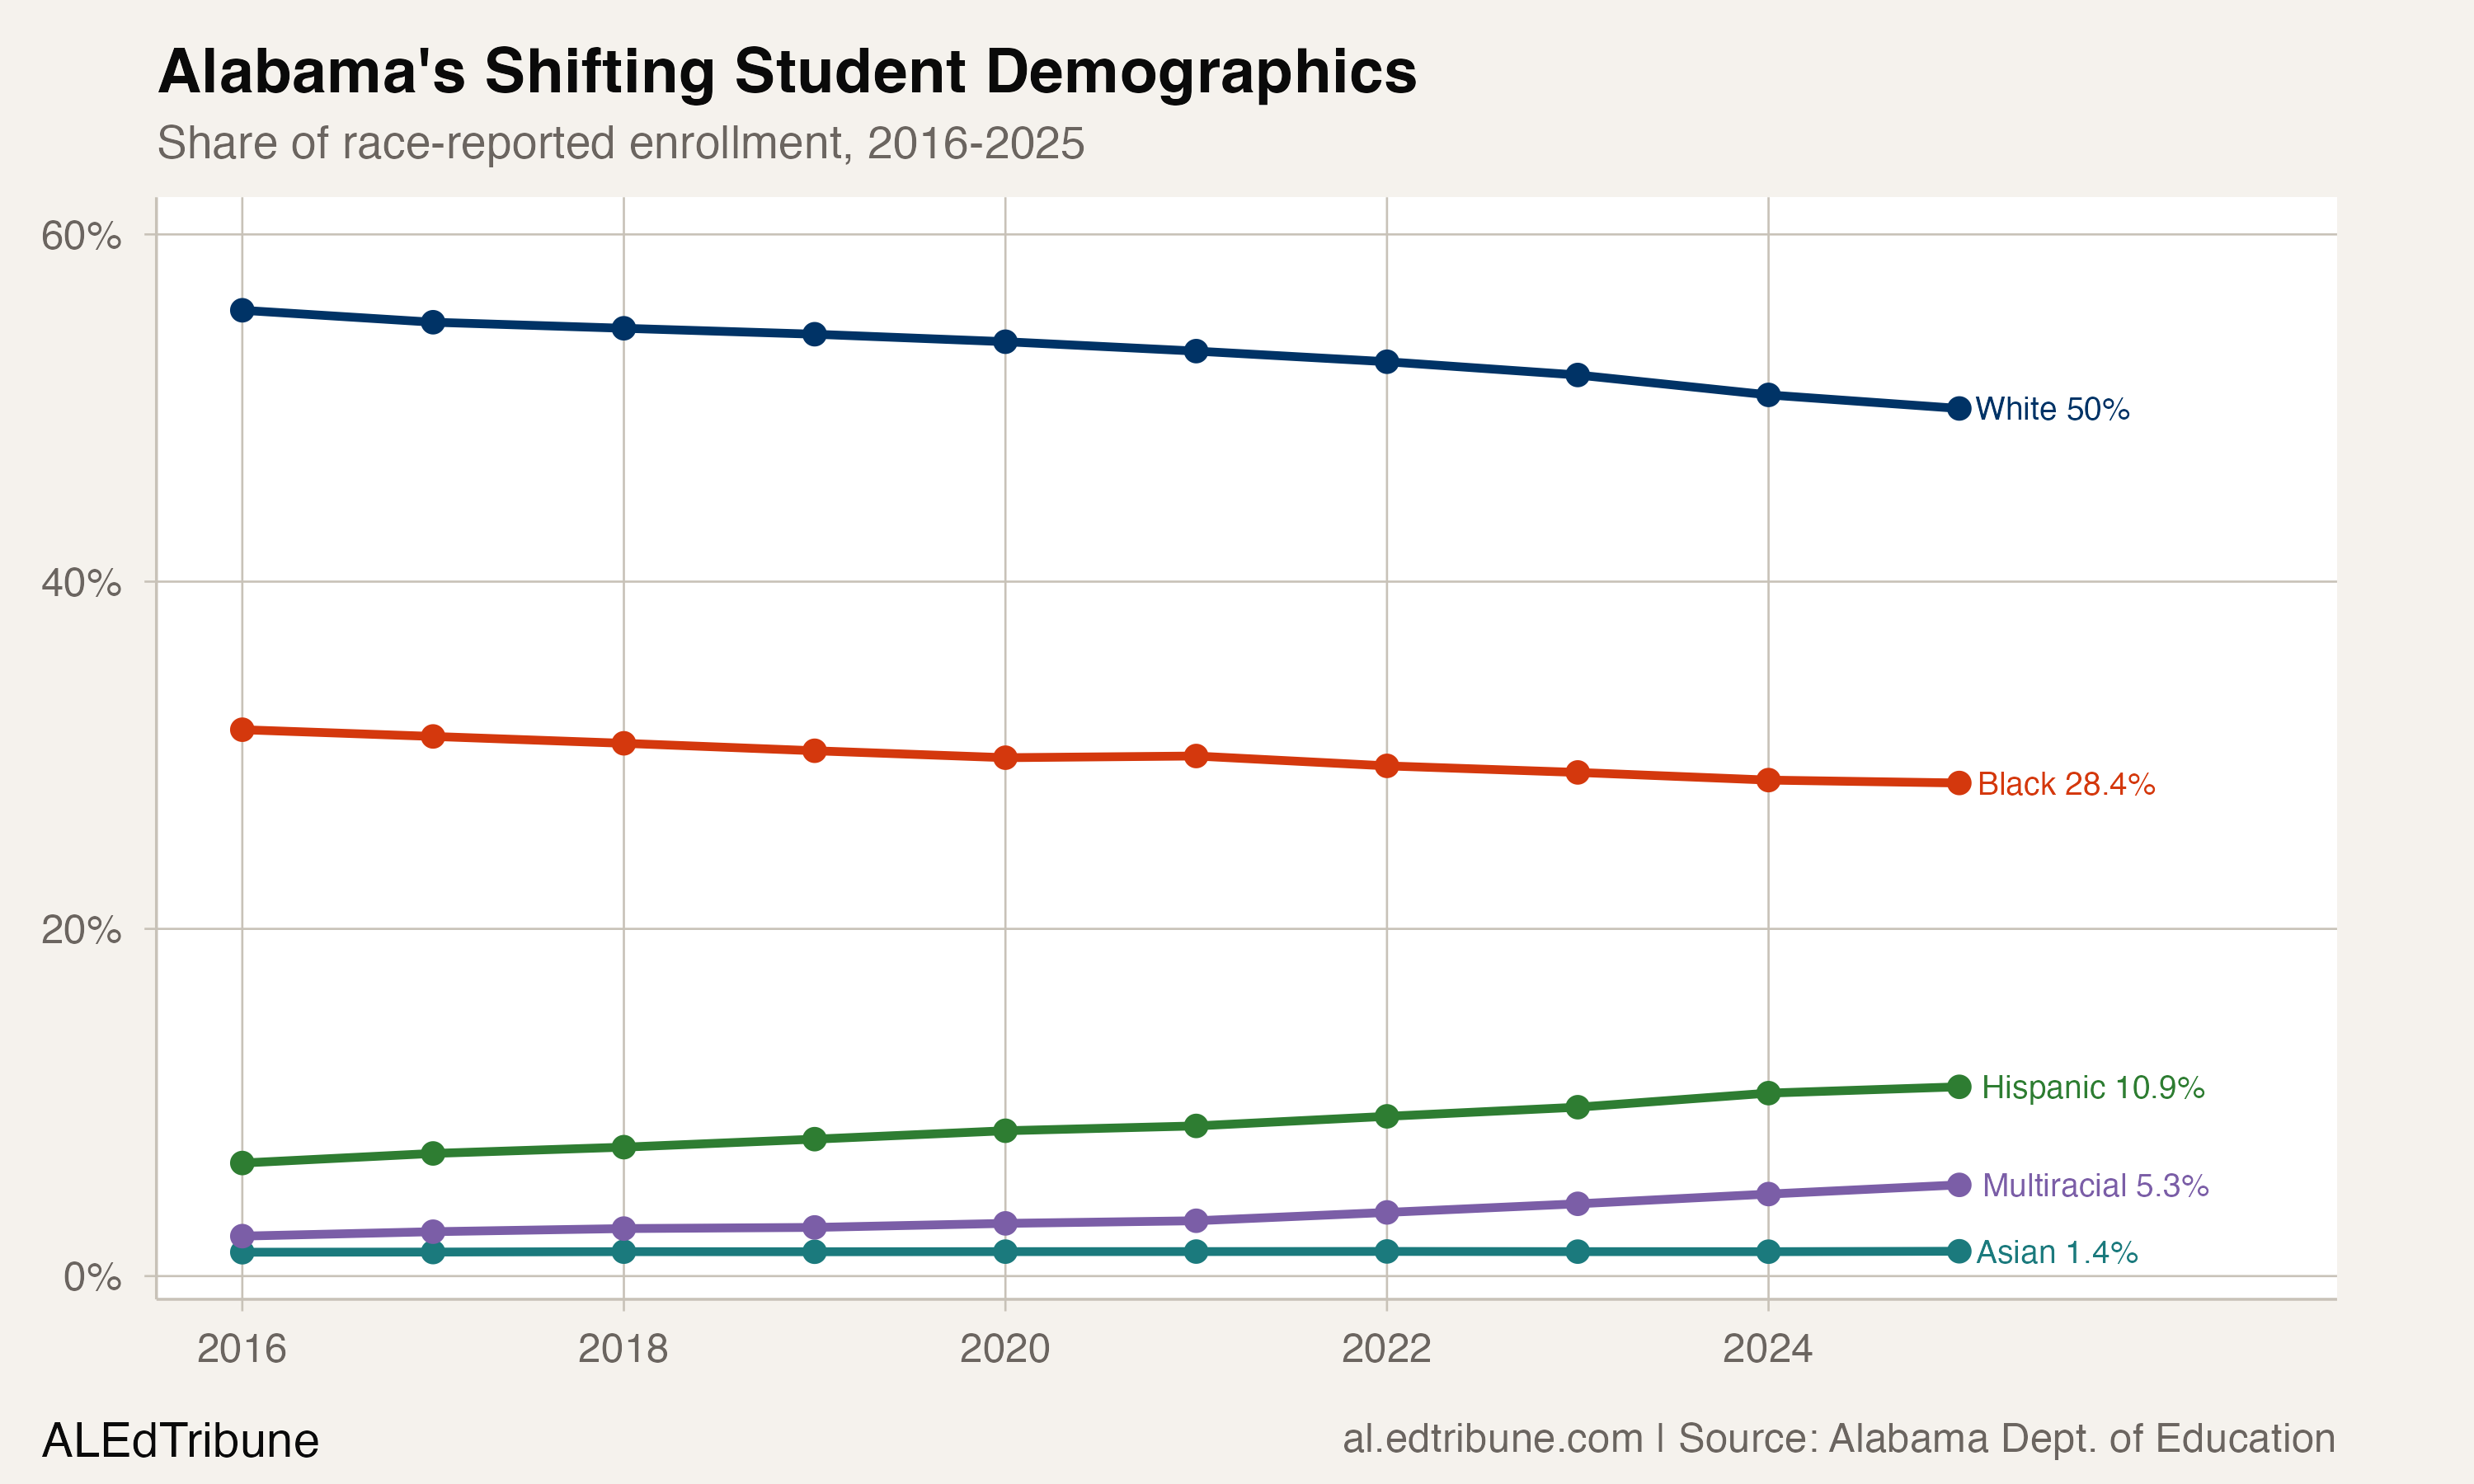
In the late 1990s, nearly two out of three students in Alabama public schools were white. By 2016, that share had fallen to 55.6%. In 2024-25, it reached 50.0%, dropping below the majority threshold for the first time in the state's history of racial enrollment reporting.
The crossing is narrow: white students comprised 402,422 of the 805,263 students identified by race, a share of 49.97% before rounding. But the direction is unambiguous. White enrollment has declined every year for a decade, shedding 43,801 students since 2016, a 9.8% drop. No single year produced a cliff. The decline averaged about 0.6 percentage points annually, then accelerated to 1.2 points in 2024 before settling back to 0.8 points in 2025.
Alabama is not unusual in this. Nationally, white students fell below 50% of public school enrollment in 2014. But Alabama held the line longer than many Southern peers. The state now joins a list that includes South Carolina, Virginia, and Florida where the demographic math has tipped within the last decade.
The growth that offset the loss
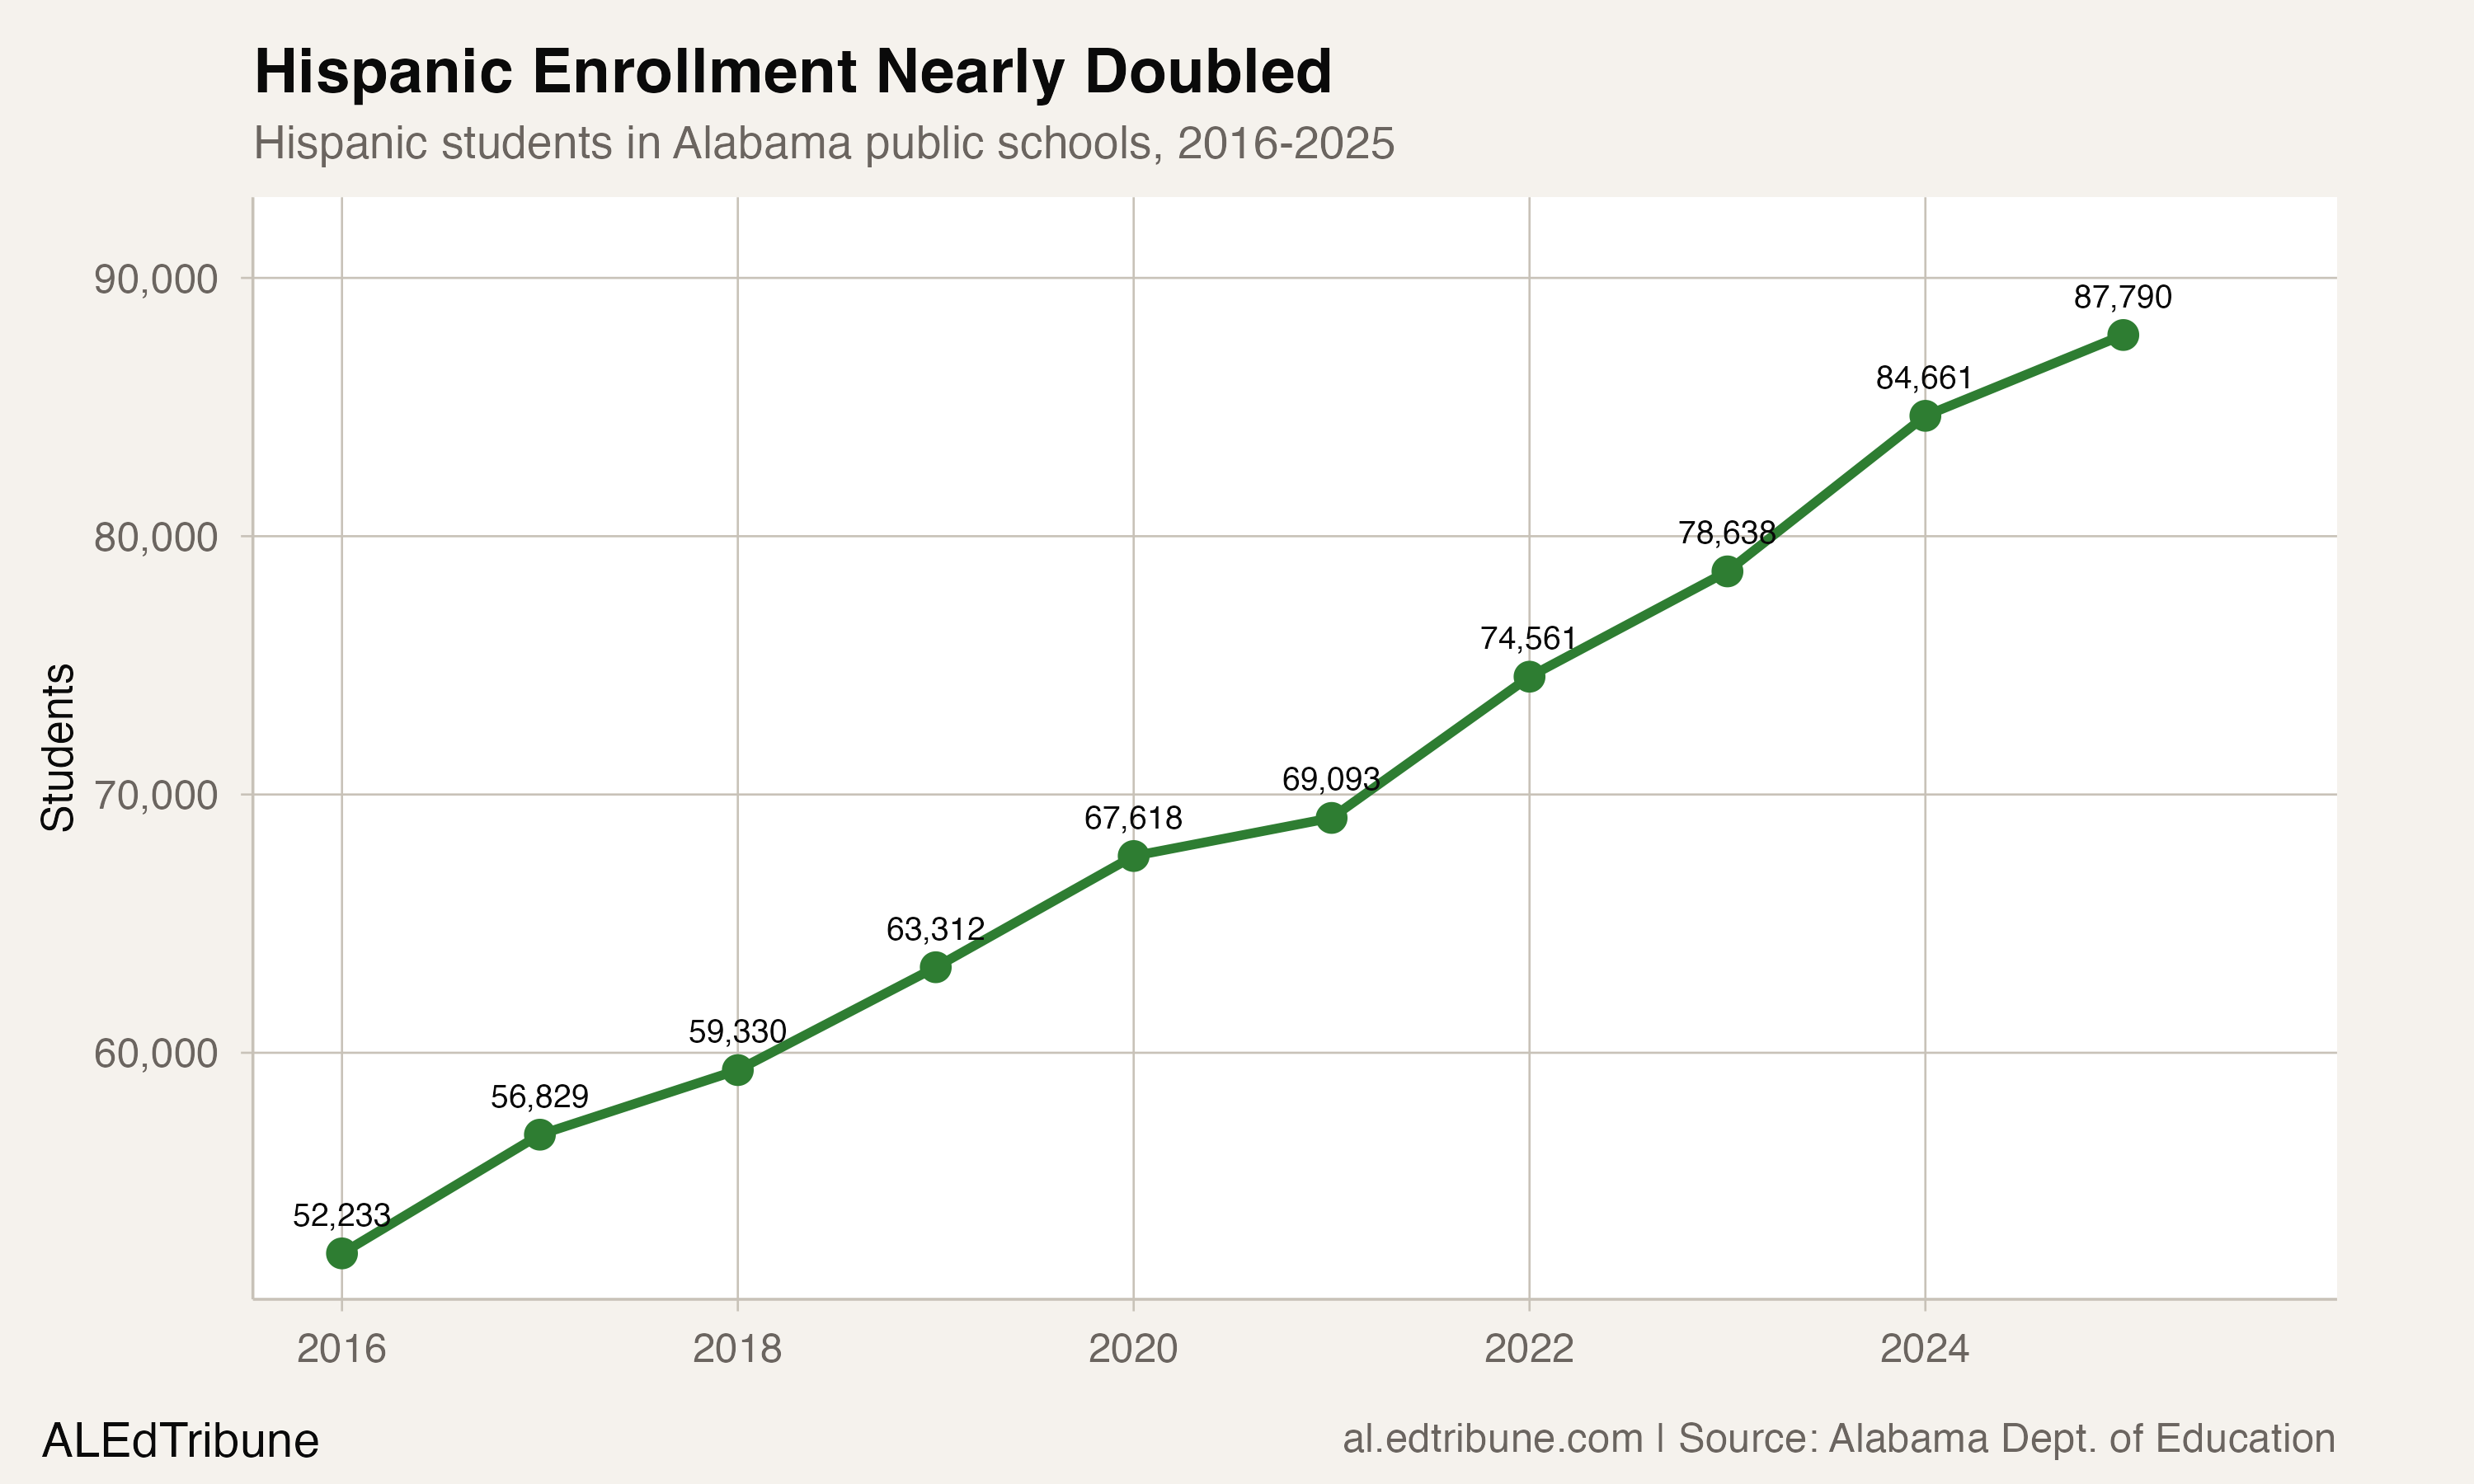
White and Black enrollment both fell since 2016: white by 43,801 students, Black by 23,725. Together, the state's two largest racial groups lost 67,526 students. What kept Alabama's total enrollment from collapsing even faster was growth in three smaller groups.
Hispanic enrollment nearly doubled, rising from 52,233 to 87,790, a gain of 35,557 students and a 68.1% increase. Multiracial enrollment more than doubled, growing from 18,460 to 42,305, a gain of 23,845 (up 129.2%). Students identified as Native American grew by 10,348, a 51.1% increase, though this figure likely reflects reclassification patterns rather than population growth of that magnitude.
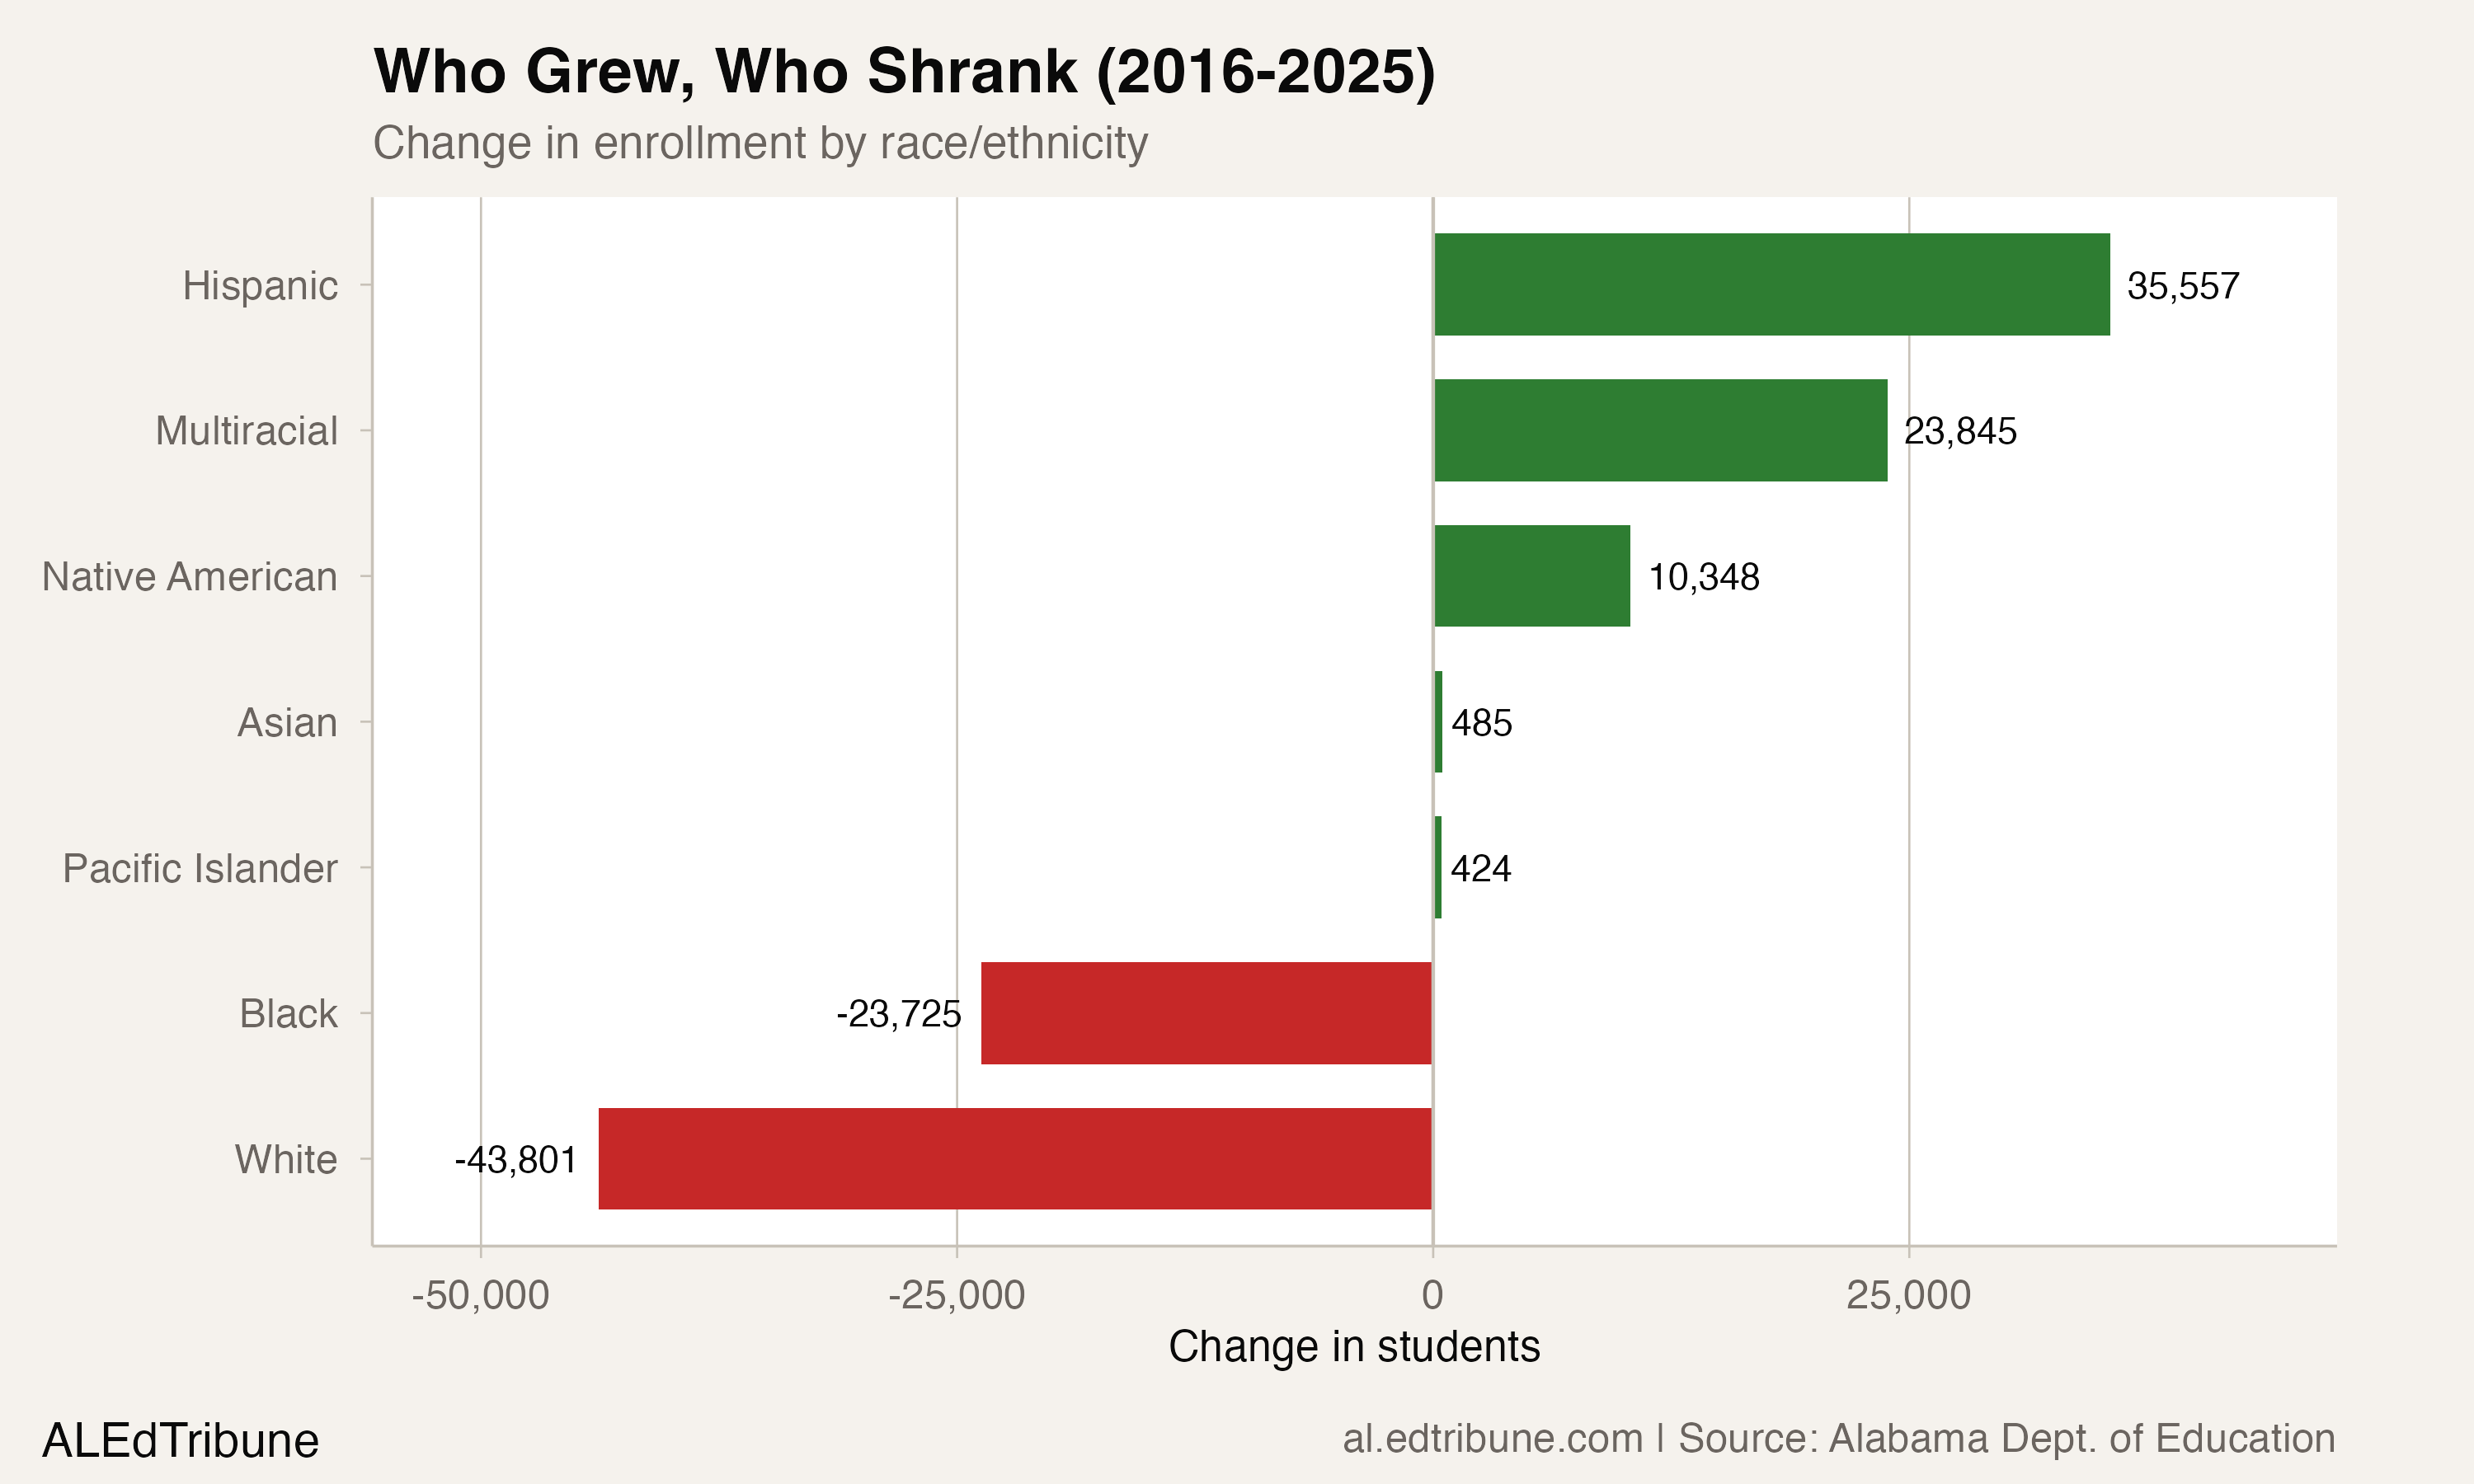
The combined gains of 69,750 students in these three groups nearly matched the combined losses of 67,526 among white and Black students. The state's student body did not shrink because one group left. It transformed because three groups grew while two contracted.
Where Hispanic growth reshaped districts
The statewide Hispanic share reached 10.9% in 2025, up from 6.5% nine years earlier. But the average masks concentration. In Albertville↗ET, Hispanic students constitute 38.1% of race-reported enrollment. In Russellville↗ET, they are 38.5%. In Decatur↗ET, 27.5%.
These are poultry-processing communities in north Alabama, where the industry has drawn Hispanic families for decades. Albertville's district enrolls roughly 5,800 students. When Haitian immigrants began arriving in 2024 under expanded federal protections, the district enrolled 110 new students in a single year.
That growth has now stalled. Superintendent Bart Reeves told Alabama Daily News in November 2025 that the district's newcomer academy had stopped enrolling new students entirely.
"That's just not happening this year with the closure of the border." -- Alabama Daily News, Nov. 2025
Reeves estimated the enrollment decline would cost the district roughly 12 teaching positions. The state provides $488 per English learner annually, with federal funding adding just $89 per student. For districts that built staffing around a growing EL population, a reversal in immigration patterns creates immediate fiscal pressure.
Thirteen districts flipped from white-majority to majority-minority between 2016 and 2025. Albertville's swing was the largest: from 56.4% white to 32.6%, a 23.8-point shift driven almost entirely by Hispanic growth. Boaz, another poultry-belt district, swung 16.7 points. Florence, Tuscaloosa County, and Decatur each shifted more than 7 points.
The multiracial question
The 129.2% growth in multiracial enrollment since 2016 is the largest percentage increase of any racial group. Some of this reflects genuinely rising rates of multiracial identification, consistent with national Census trends. But a significant share likely reflects how families answer race questions on school forms, not a change in who is sitting in classrooms.
In 2025-26, the federal government changed how schools collect race and ethnicity data. The new form, required by the Office of Management and Budget, replaced the old two-question format (one question on ethnicity, one on race) with a single question inviting respondents to check all identities that apply. The result was stark: the reported Hispanic count dropped by 56,196 while the "two or more races" category jumped by 52,627, a near-perfect offset.
"The number of students who checked the Hispanic box increased by about 1,000 statewide." -- Public Affairs Research Council of Alabama, Dec. 2025
State education officials concluded that many students who previously identified solely as Hispanic were now selecting Hispanic alongside another racial category, landing them in the multiracial bucket. The actual number of students with Hispanic heritage likely grew slightly. But the 2026 data, which contains only total enrollment and no demographics, means the full impact of this reclassification cannot yet be assessed against the longer trend.
The pre-2026 multiracial growth was real and substantial even before the form change: from 18,460 in 2016 to 42,305 in 2025, a period when the old two-question format was still in use. Federal reporting changes amplified an existing trend, but did not create it.
Two Alabamas on either side of 50%
The statewide crossing obscures how polarized Alabama's districts remain. Of 140 districts with at least 500 students reporting race data, 79 still have white majorities and 61 are majority-minority. The distribution is not a bell curve clustering near 50%. It is bimodal: a cluster of districts between 55% and 80% white, and another cluster below 35%.
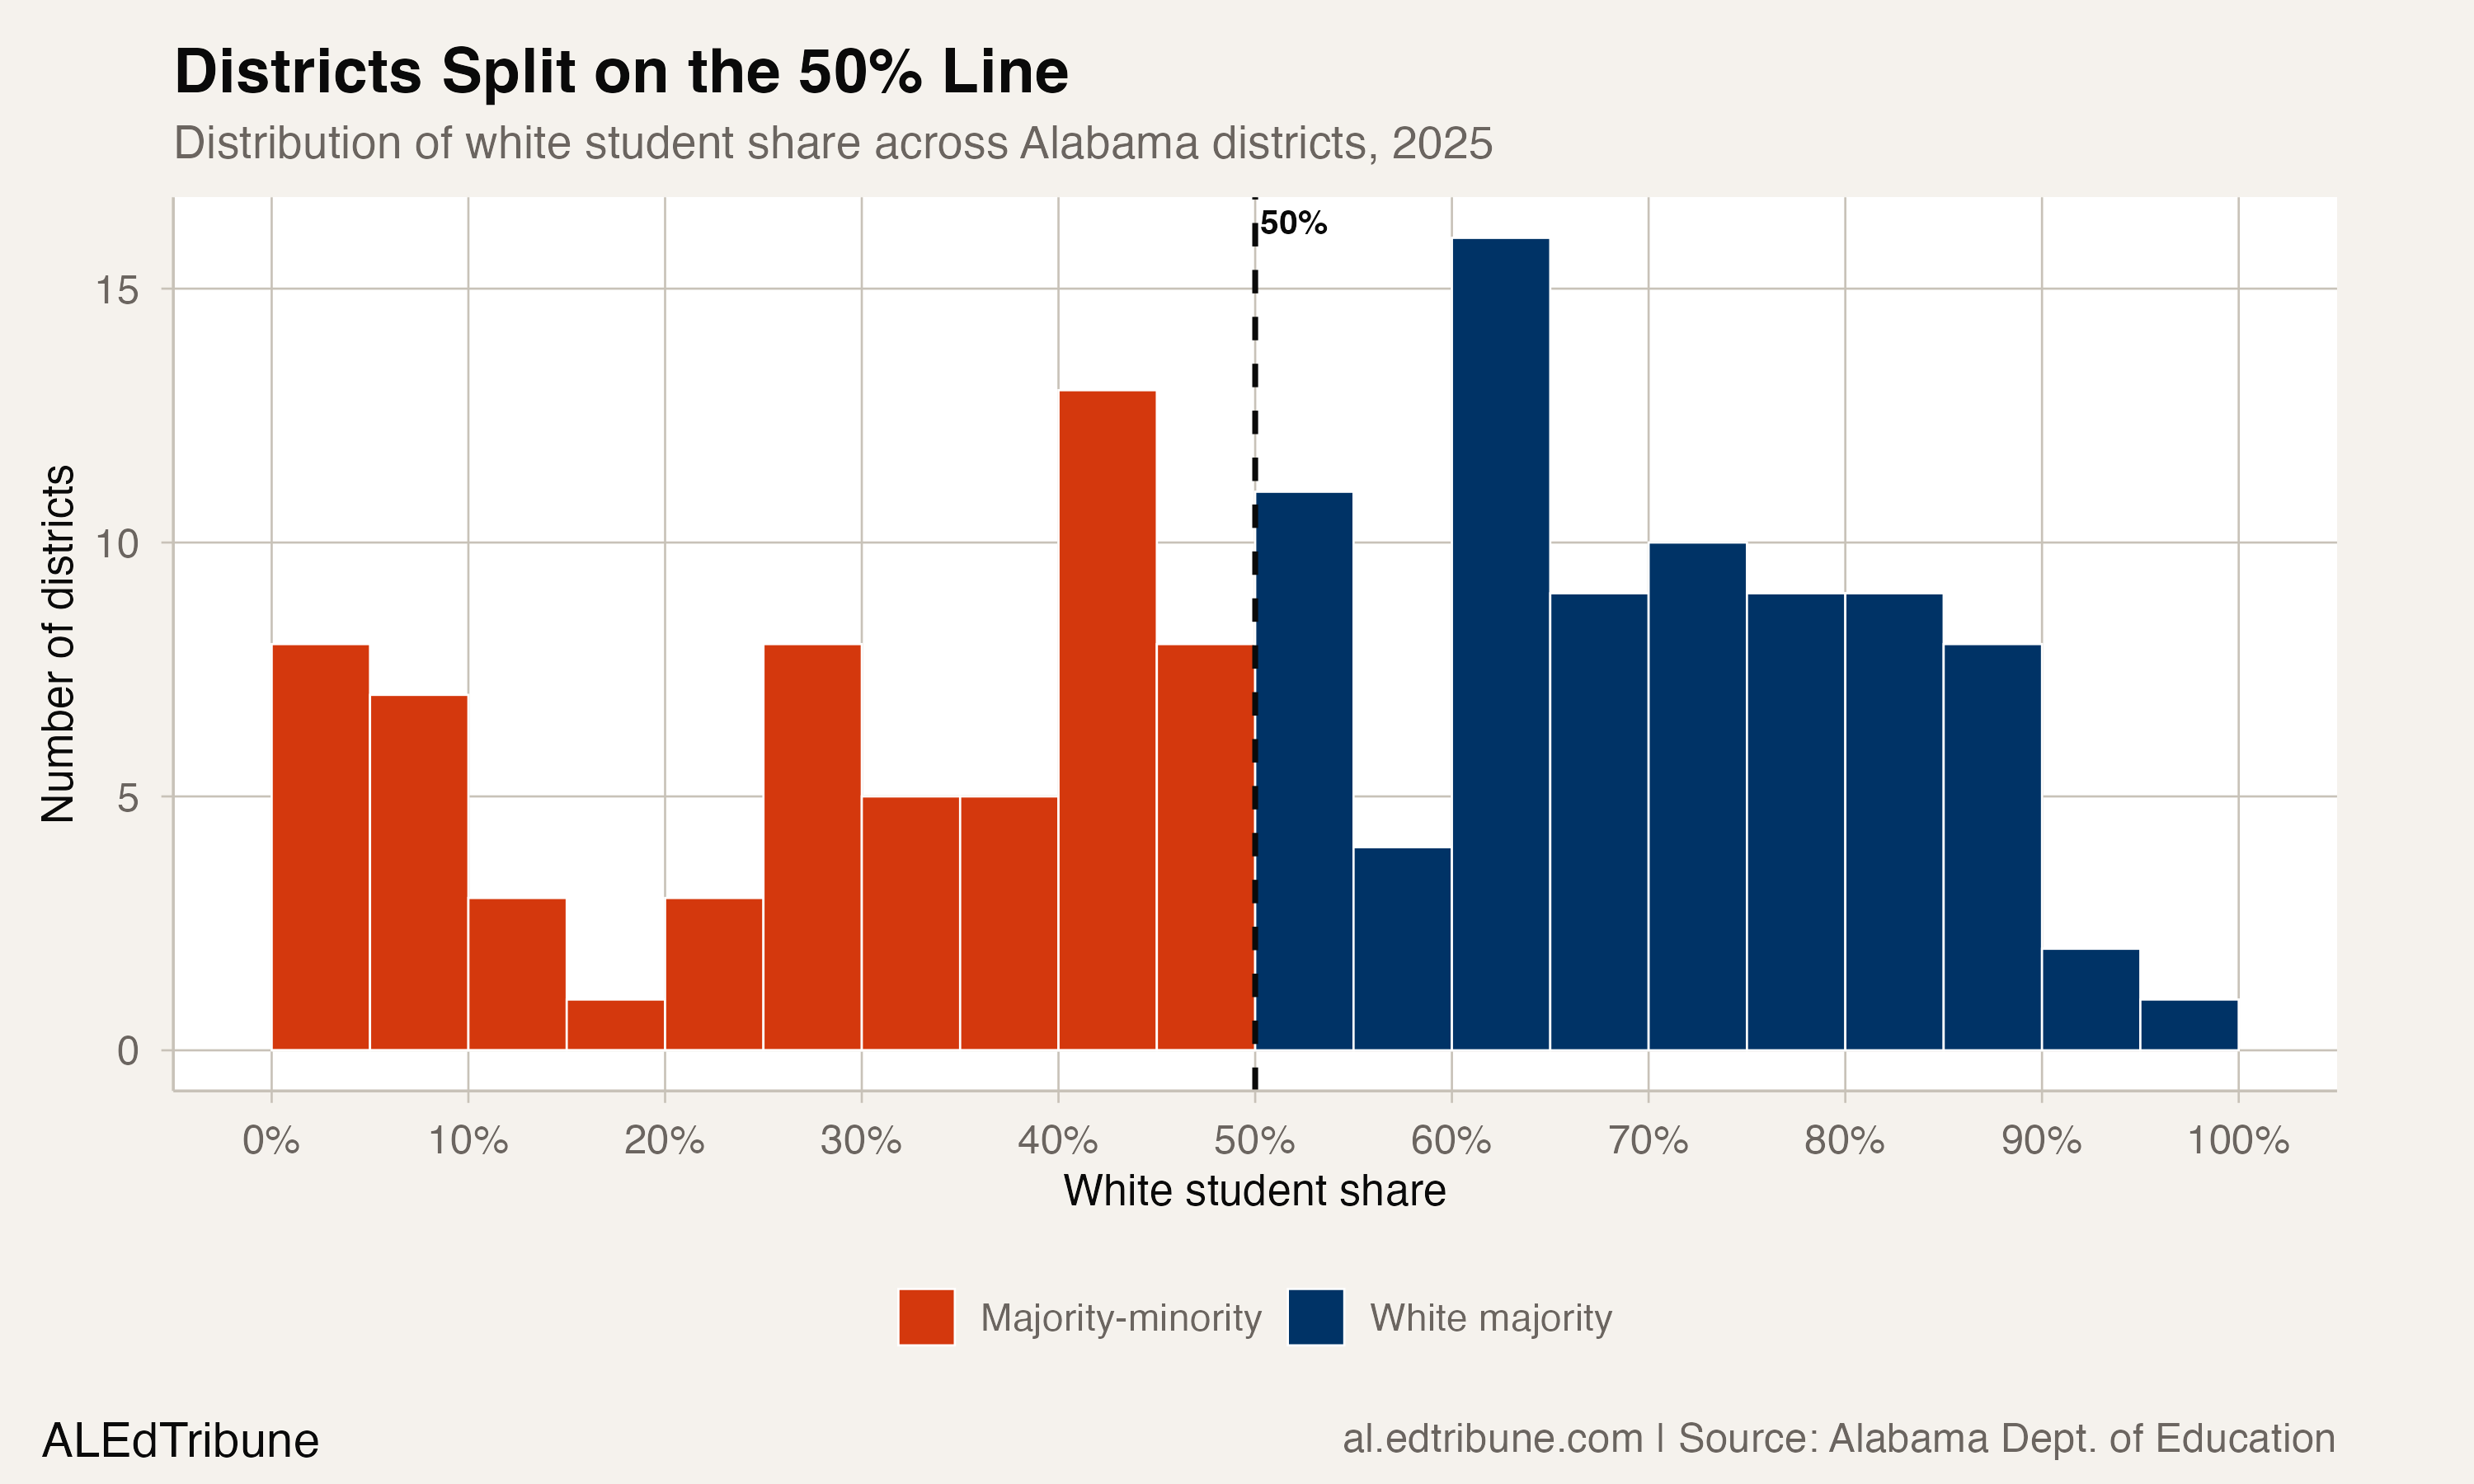
At one extreme, Winston County is 96.0% white. Mountain Brook, the affluent Birmingham↗ET suburb, is 93.8%. At the other, Wilcox County in the Black Belt is 1.1% white. Selma is 1.4%. Birmingham City, the state's second-largest district with 22,482 race-reported students, is 5.2% white.
The geographic pattern tracks Alabama's historical racial geography almost exactly. Black Belt counties that were plantation centers remain overwhelmingly Black. Appalachian foothill counties remain overwhelmingly white. The demographic change is happening in the middle: mid-sized cities and suburban districts where Hispanic and multiracial growth is reshaping what were once binary Black-white enrollment profiles.
The Black enrollment paradox
Black students' share of enrollment fell from 31.5% to 28.4% between 2016 and 2025, a loss of 23,725 students. In absolute terms, this is the second-largest decline after white enrollment. Yet the Black share has been remarkably stable in the 28-31% band for a decade, because the denominator (total race-reported enrollment) is also shrinking.
The loss is concentrated in the Black Belt and in Alabama's three largest majority-Black urban systems. Mobile County↗ET lost more than 1,000 students in 2025-26 alone. Montgomery and Birmingham have each seen enrollment fall by roughly a fifth over the past decade. The Alabama Reflector reported in 2024 that across 17 rural Black Belt counties, student enrollment dropped 19.8% between 2014 and 2023, nearly eight times the statewide rate of decline.
The out-migration driving these losses is a multi-generational pattern. Young adults leave for employment in Huntsville, Birmingham's suburbs, or out of state entirely. Birth rates in rural Alabama have declined alongside national trends, with Alabama's overall fertility rate dropping to 57.9 per 1,000 women in 2023. The districts left behind face a compounding problem: fewer families means less state funding, which means fewer programs, which accelerates the next round of departures.
What the CHOOSE Act did not do
Alabama's CHOOSE Act, signed in March 2024, created education savings accounts worth roughly $7,000 per student. Given the timing, it is reasonable to ask whether ESA-driven departures contributed to white enrollment decline. The available evidence suggests the impact was modest.
Of the roughly 5,800 students who left Alabama public schools in the CHOOSE Act's first year, approximately 3,000 received ESA funds. But most ESA recipients were already enrolled in private schools. Of the 14,000 students who planned to use ESA funds for private school in 2025-26, about 10,000 (71%) were already attending one. Only 2,428 of 5,060 eligible public school students had activated their accounts as of September 2025, fewer than half.
The CHOOSE Act may accelerate white enrollment decline modestly in future years as the program moves toward universal eligibility in 2027-28. But for now, the demographic shift predates and outpaces the voucher program. White enrollment fell by 43,801 students over nine years. The ESA program moved roughly 2,400 students from public to private in its first year. The trendline was set long before the CHOOSE Act existed.
What comes next
The 2026 data year contains only total enrollment, no demographic breakdowns. Whether white share dropped further, stabilized, or ticked back up cannot be determined until 2027 data is released. The new federal race reporting form adds another layer of uncertainty: the 2025-26 reclassification reshuffled tens of thousands of students between Hispanic and multiracial categories, making year-over-year demographic comparisons unreliable until the new methodology produces at least two consecutive years of data.
The question for Alabama's school leaders is not whether the state's public schools have become majority-minority. They have. The question is what comes after. In north Alabama poultry towns, immigration enforcement is reversing the Hispanic enrollment growth that sustained district budgets. In the Black Belt, depopulation continues with no policy intervention sufficient to reverse it. And in the suburbs, where the demographic change is newest and most contested, the CHOOSE Act's expansion could determine whether the public school system retains these families or loses them to a parallel private system.
The 50% line itself is a statistical artifact. Crossing it changes nothing about how a classroom operates or how a budget is built. But it marks the end of a demographic era in a state where the composition of public school enrollment has been a politically charged question for 70 years, and will remain one.
Detailed code that reproduces the analysis and figures in this article is available exclusively to EdTribune subscribers.
Discussion
Sign in to join the discussion.
Loading comments...