Alabama Graduation Rates: 2023 CrashET · BirminghamET · CCR GapET · Foster CareET · English Learners · MontgomeryET · Nine RecordsET
In 2023, the graduation rate for Alabama students who are English learners sat at 67.9 percent, roughly 20 points below the state average. About one in three students who are English learners and who started high school that year did not finish with a diploma.
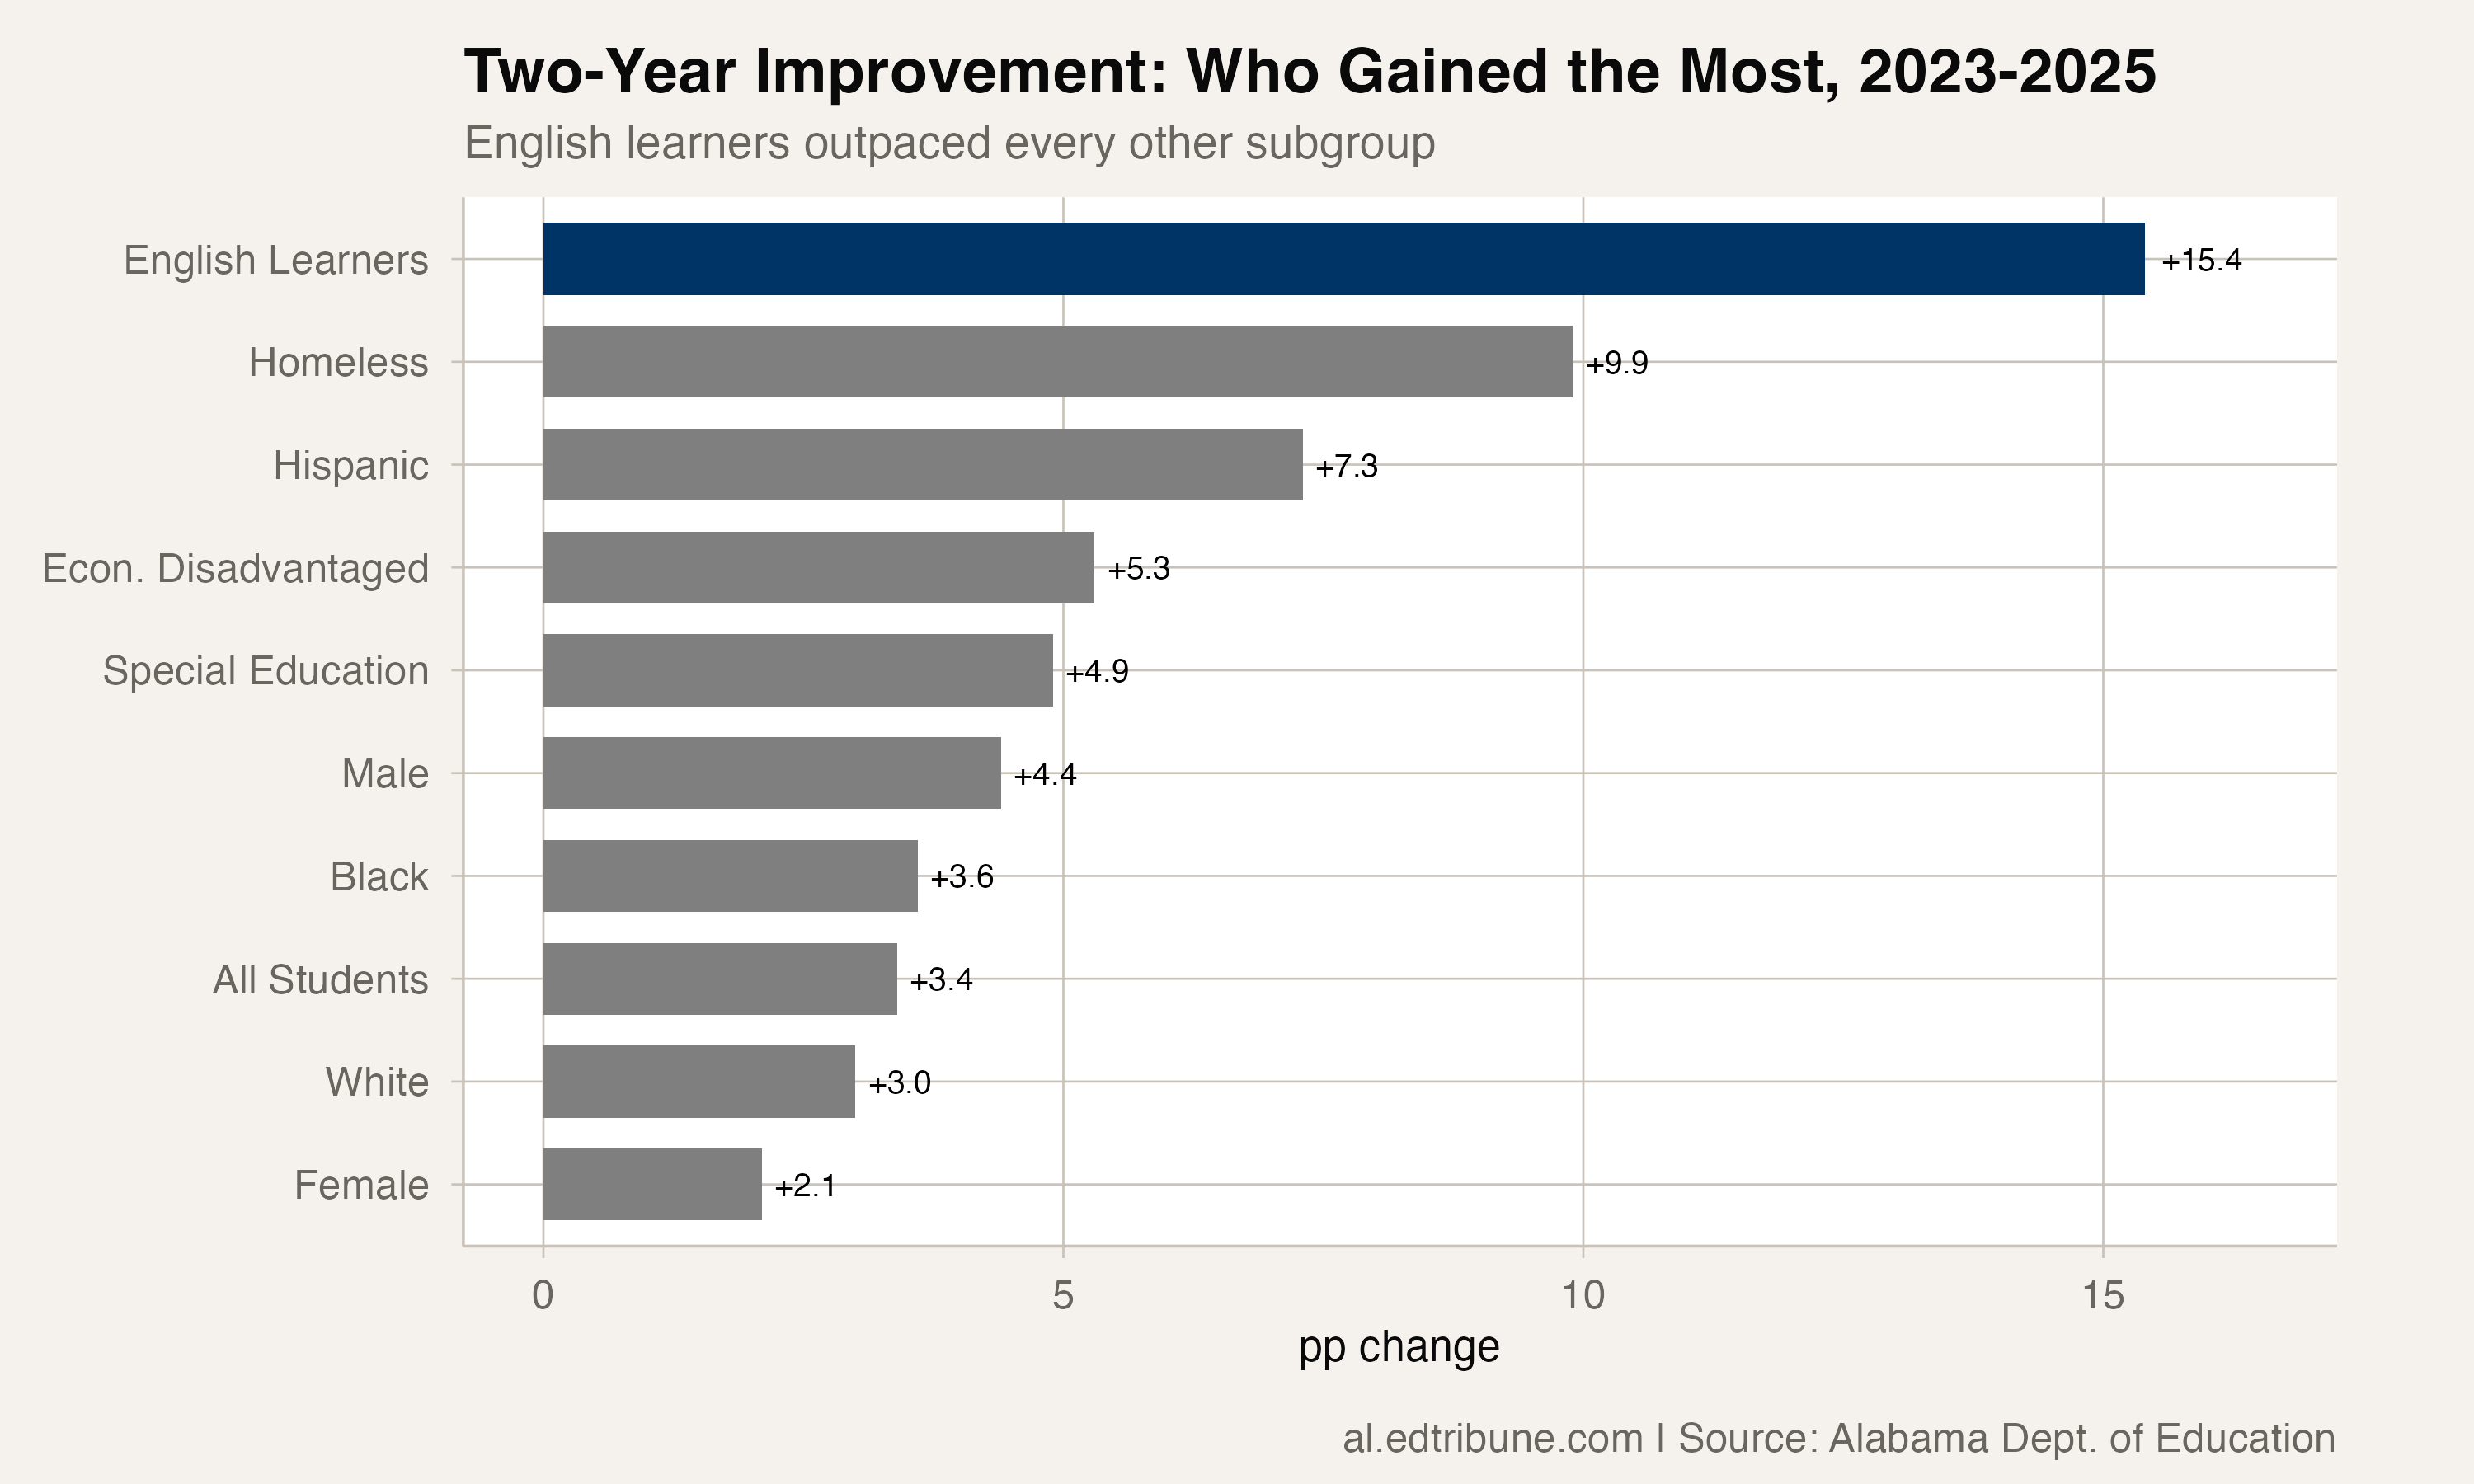
Two years later, the rate stands at 83.3 percent, an all-time high for the group. That is a 15.4 percentage point gain in two years, the fastest rise of any subgroup in the state over any two-year period in the data.
The improvement was not gradual. It came fast, and it raises as many questions as it answers.
The trajectory
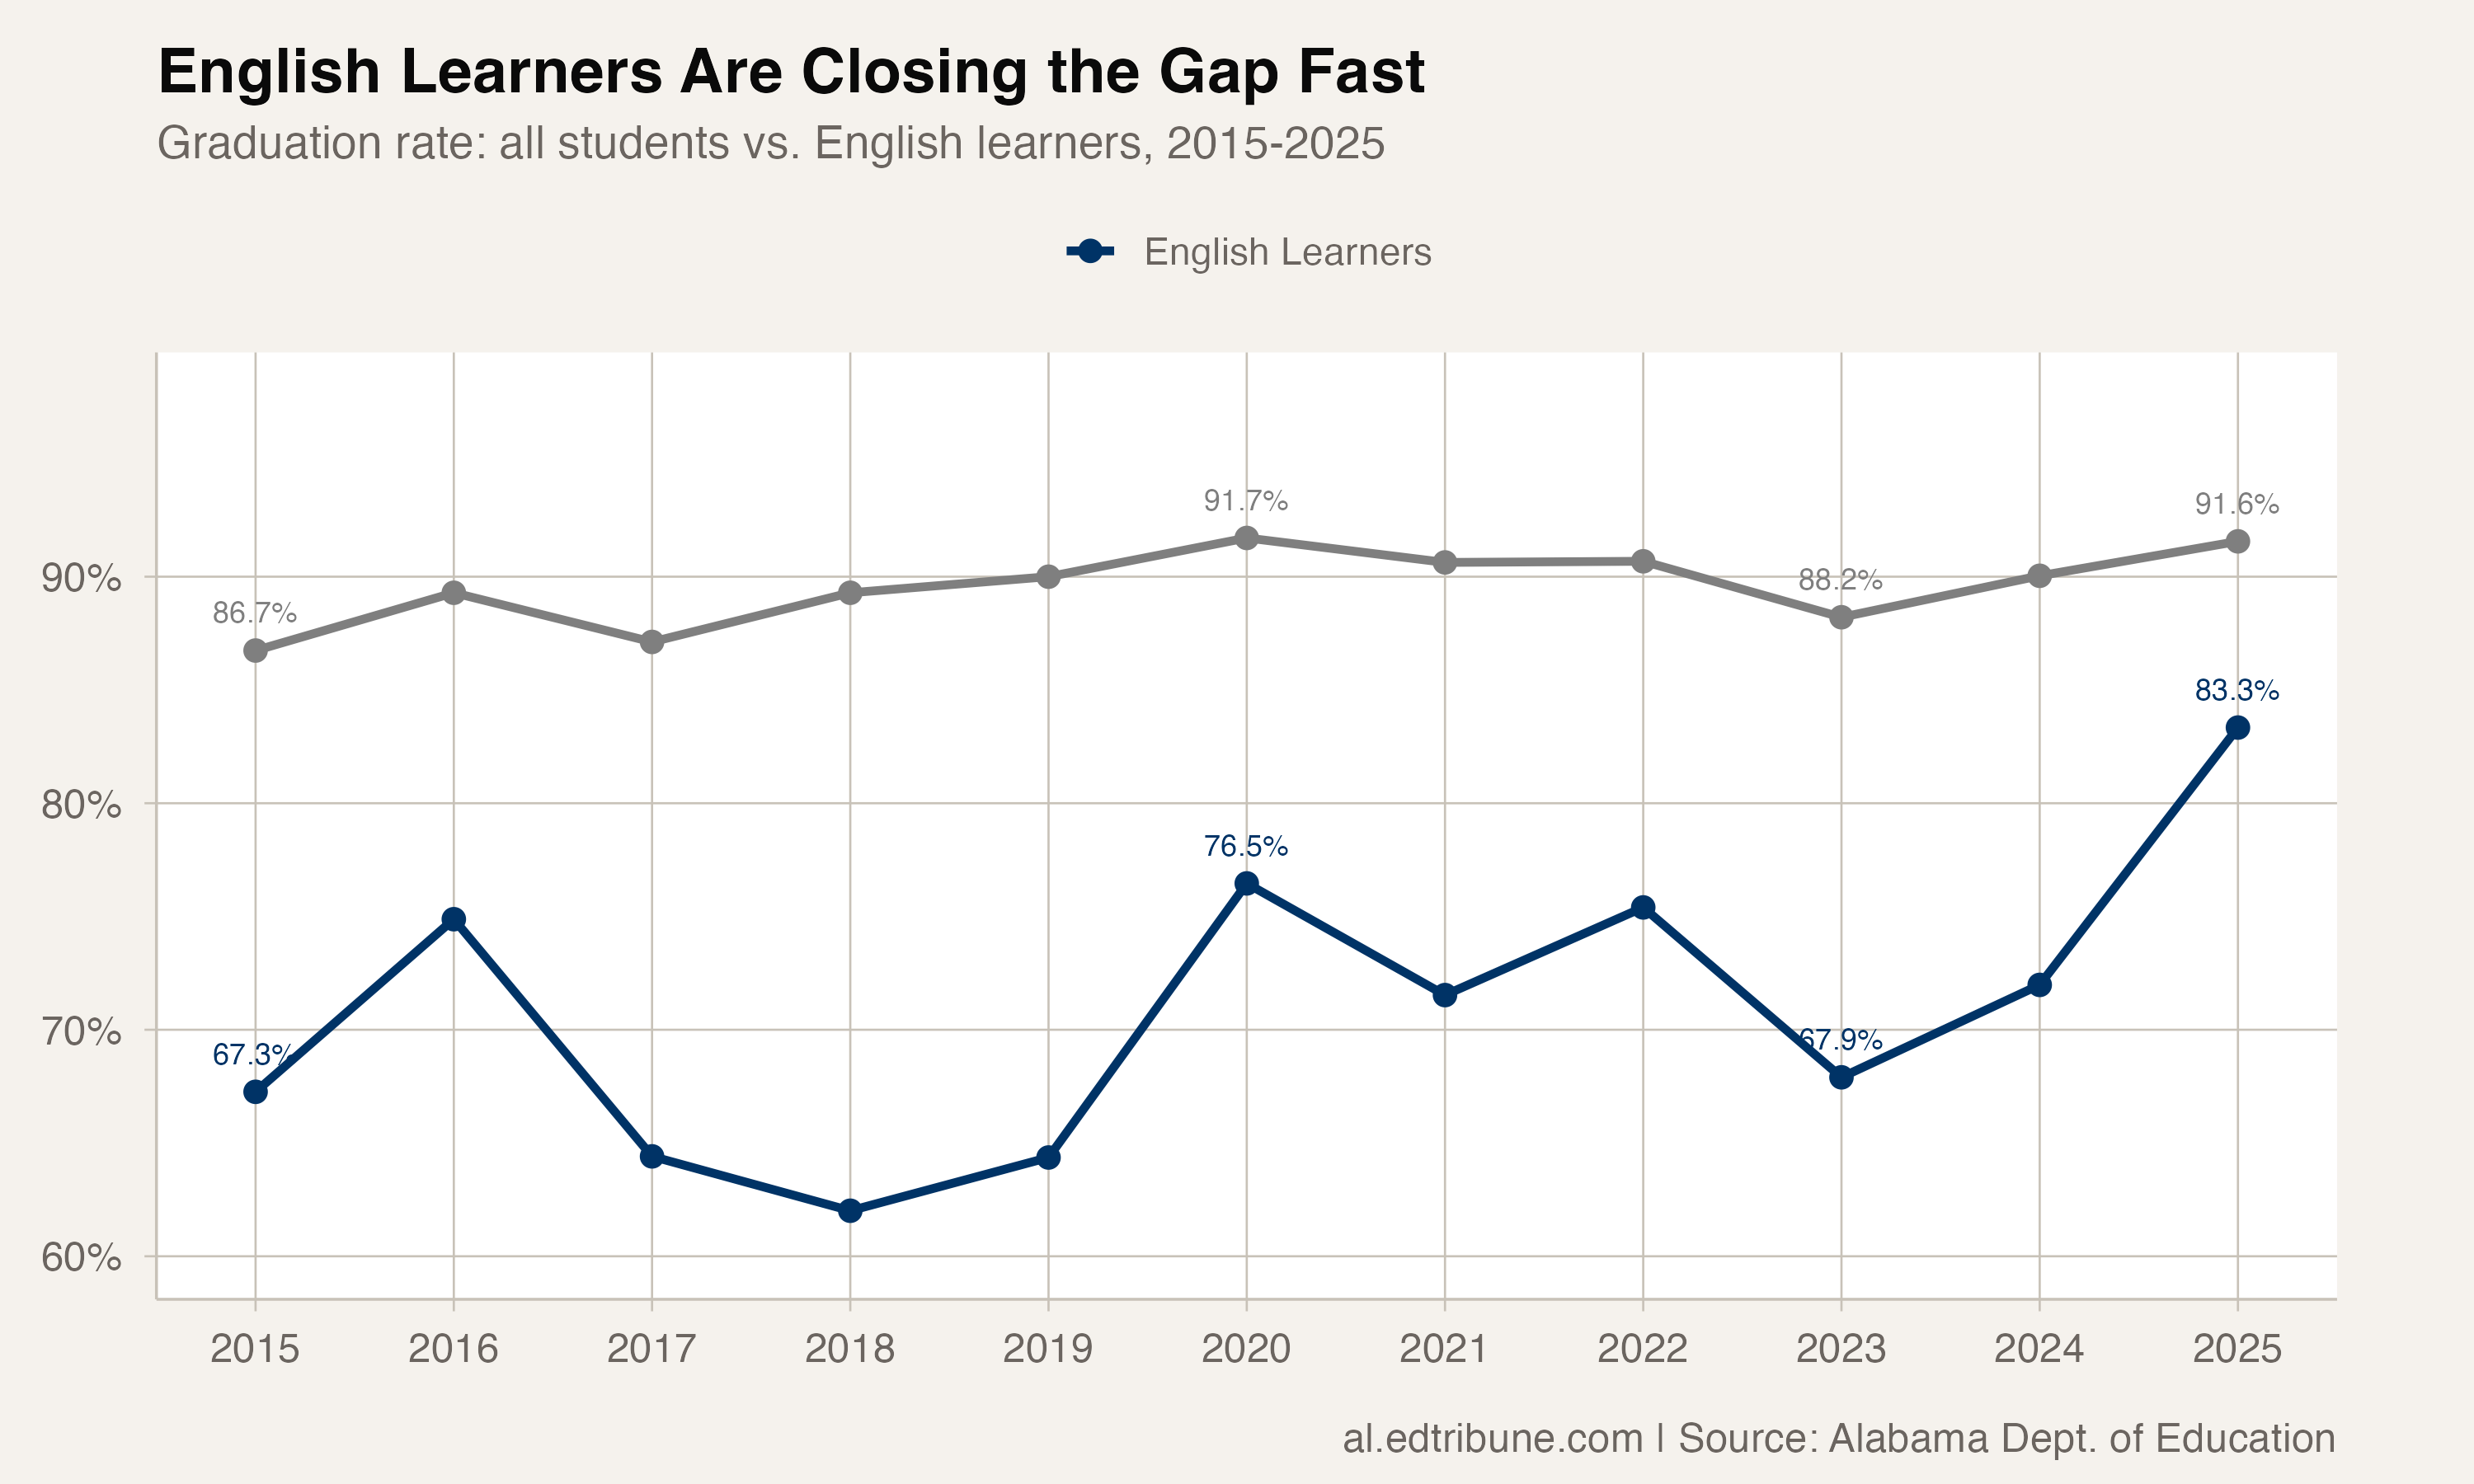
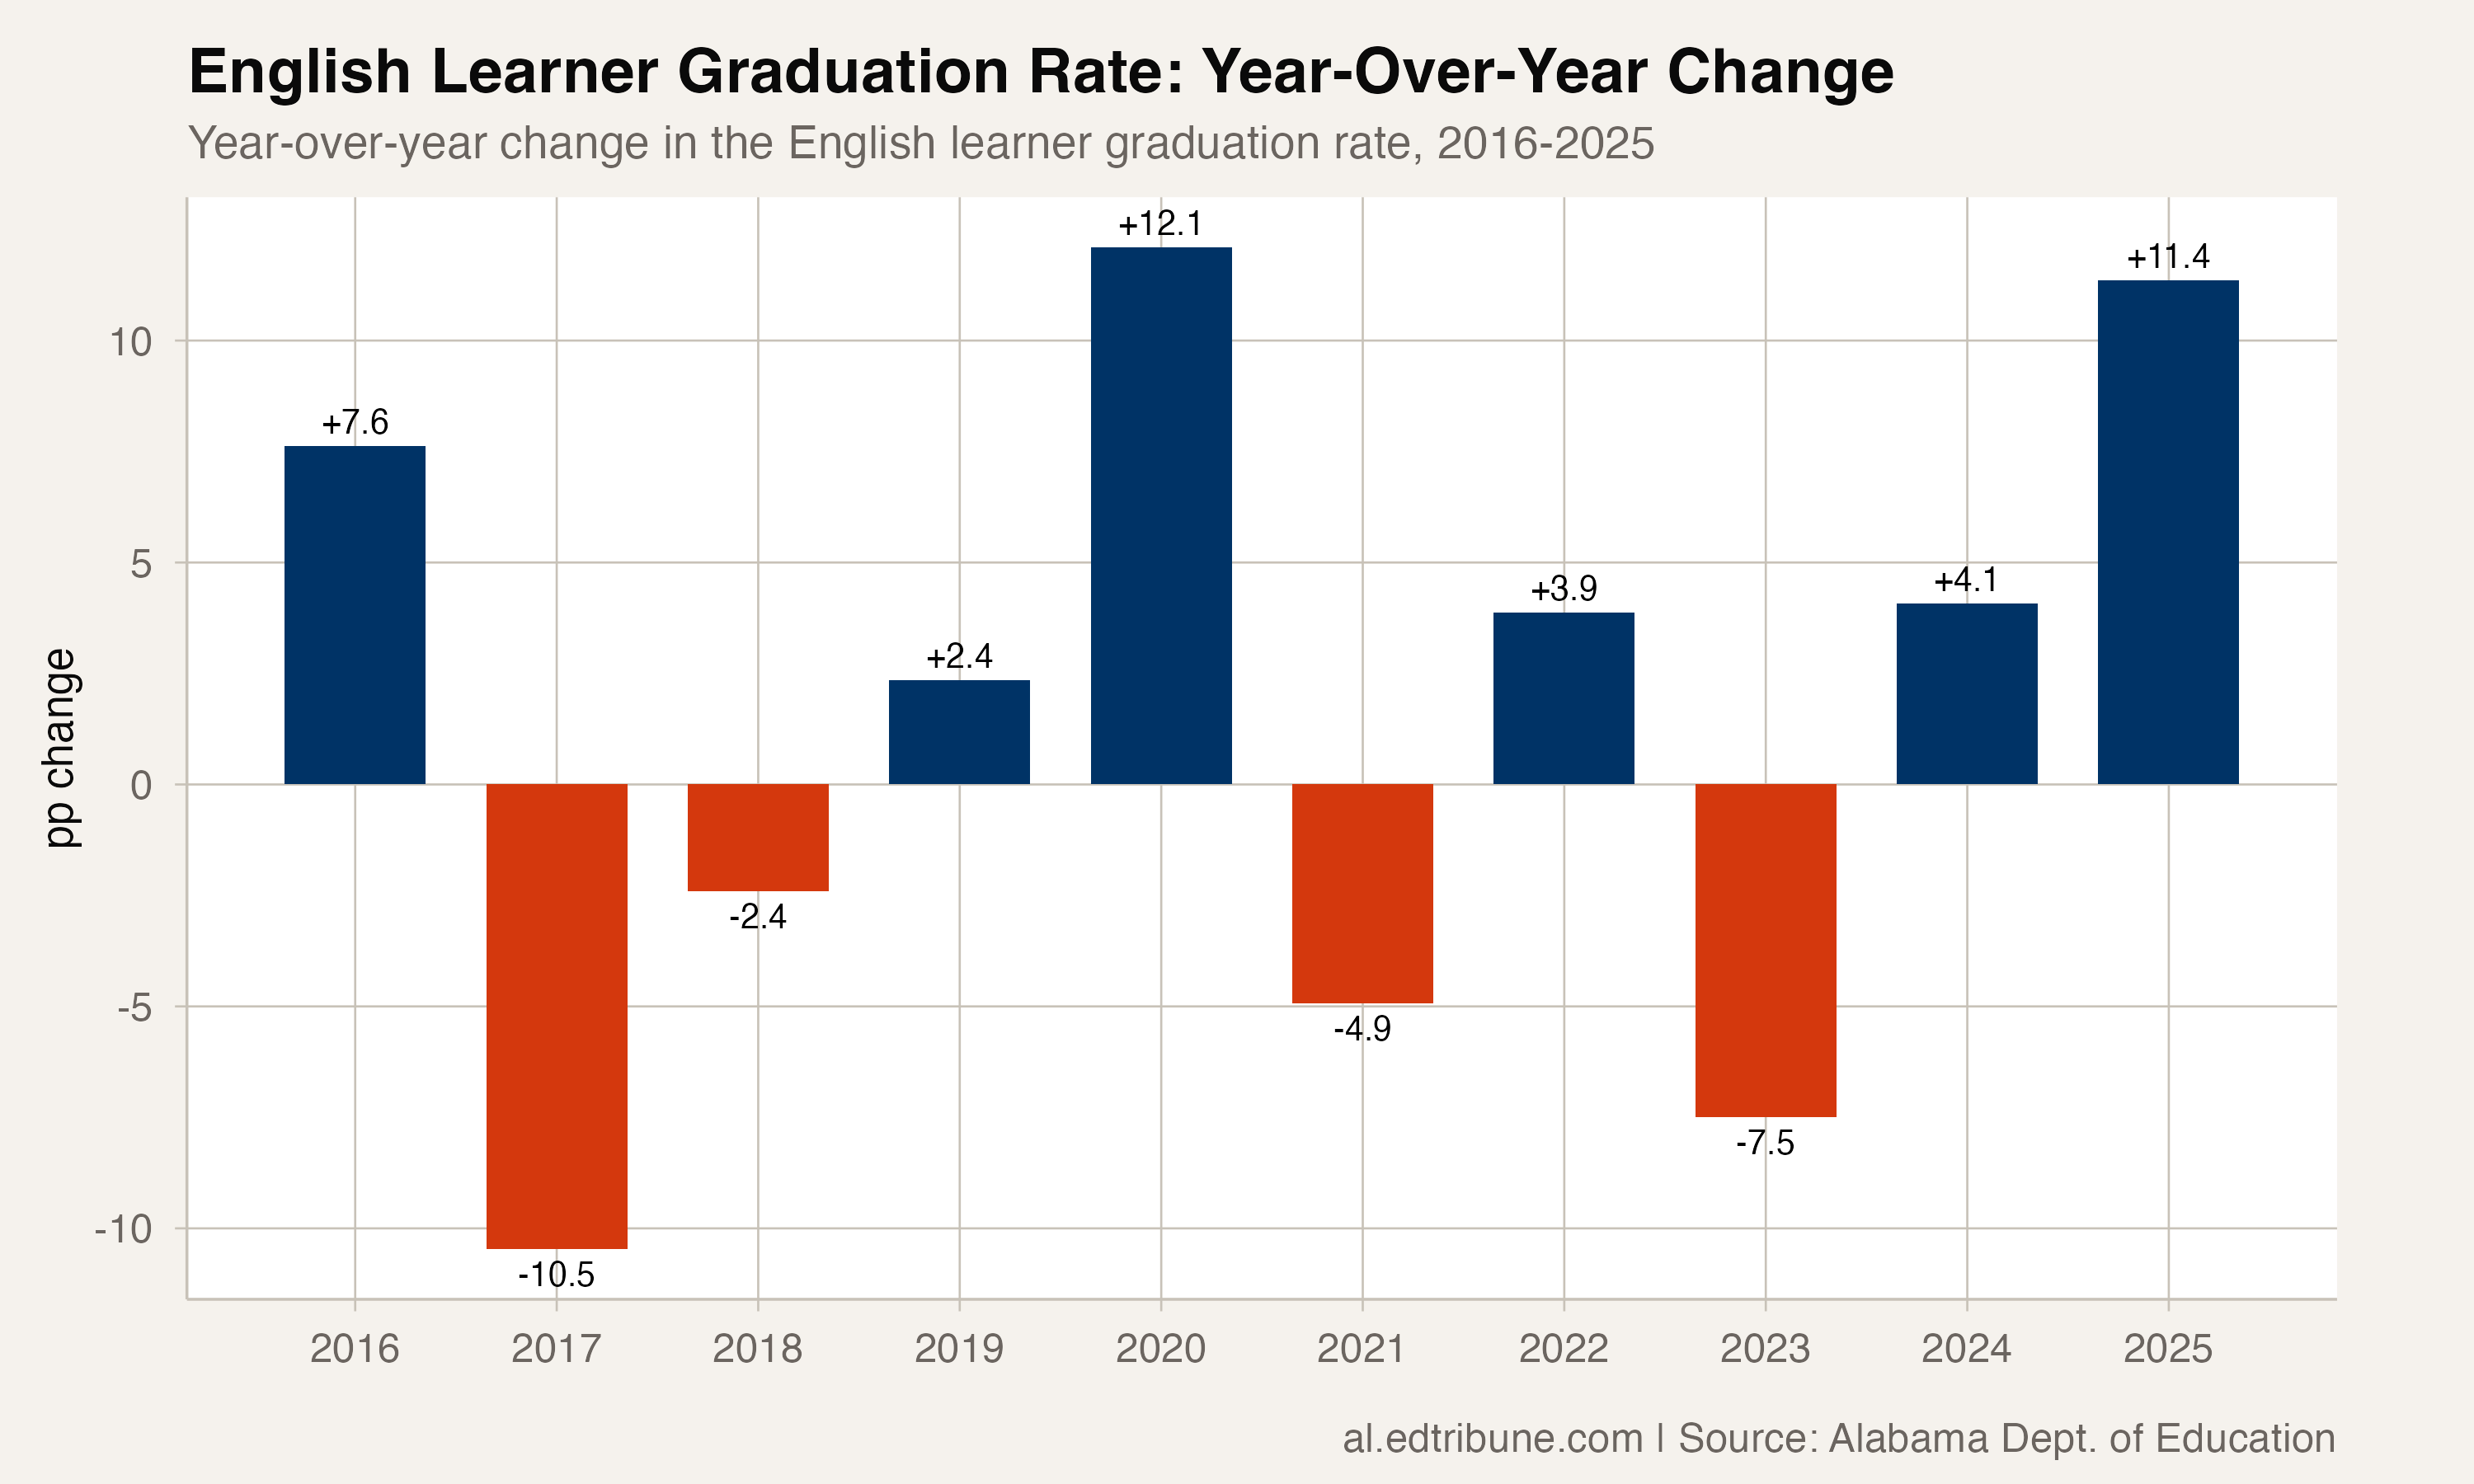
The rate has been on a volatile ride. It climbed from 67.3 percent in 2015 to 76.5 percent in 2020, then slid back to 67.9 percent by 2023 as COVID-era supports expired. Students who are English learners saw the steepest single-year decline of any group in the 2023 correction, a 7.5-point drop, more than three times the statewide decline that year.
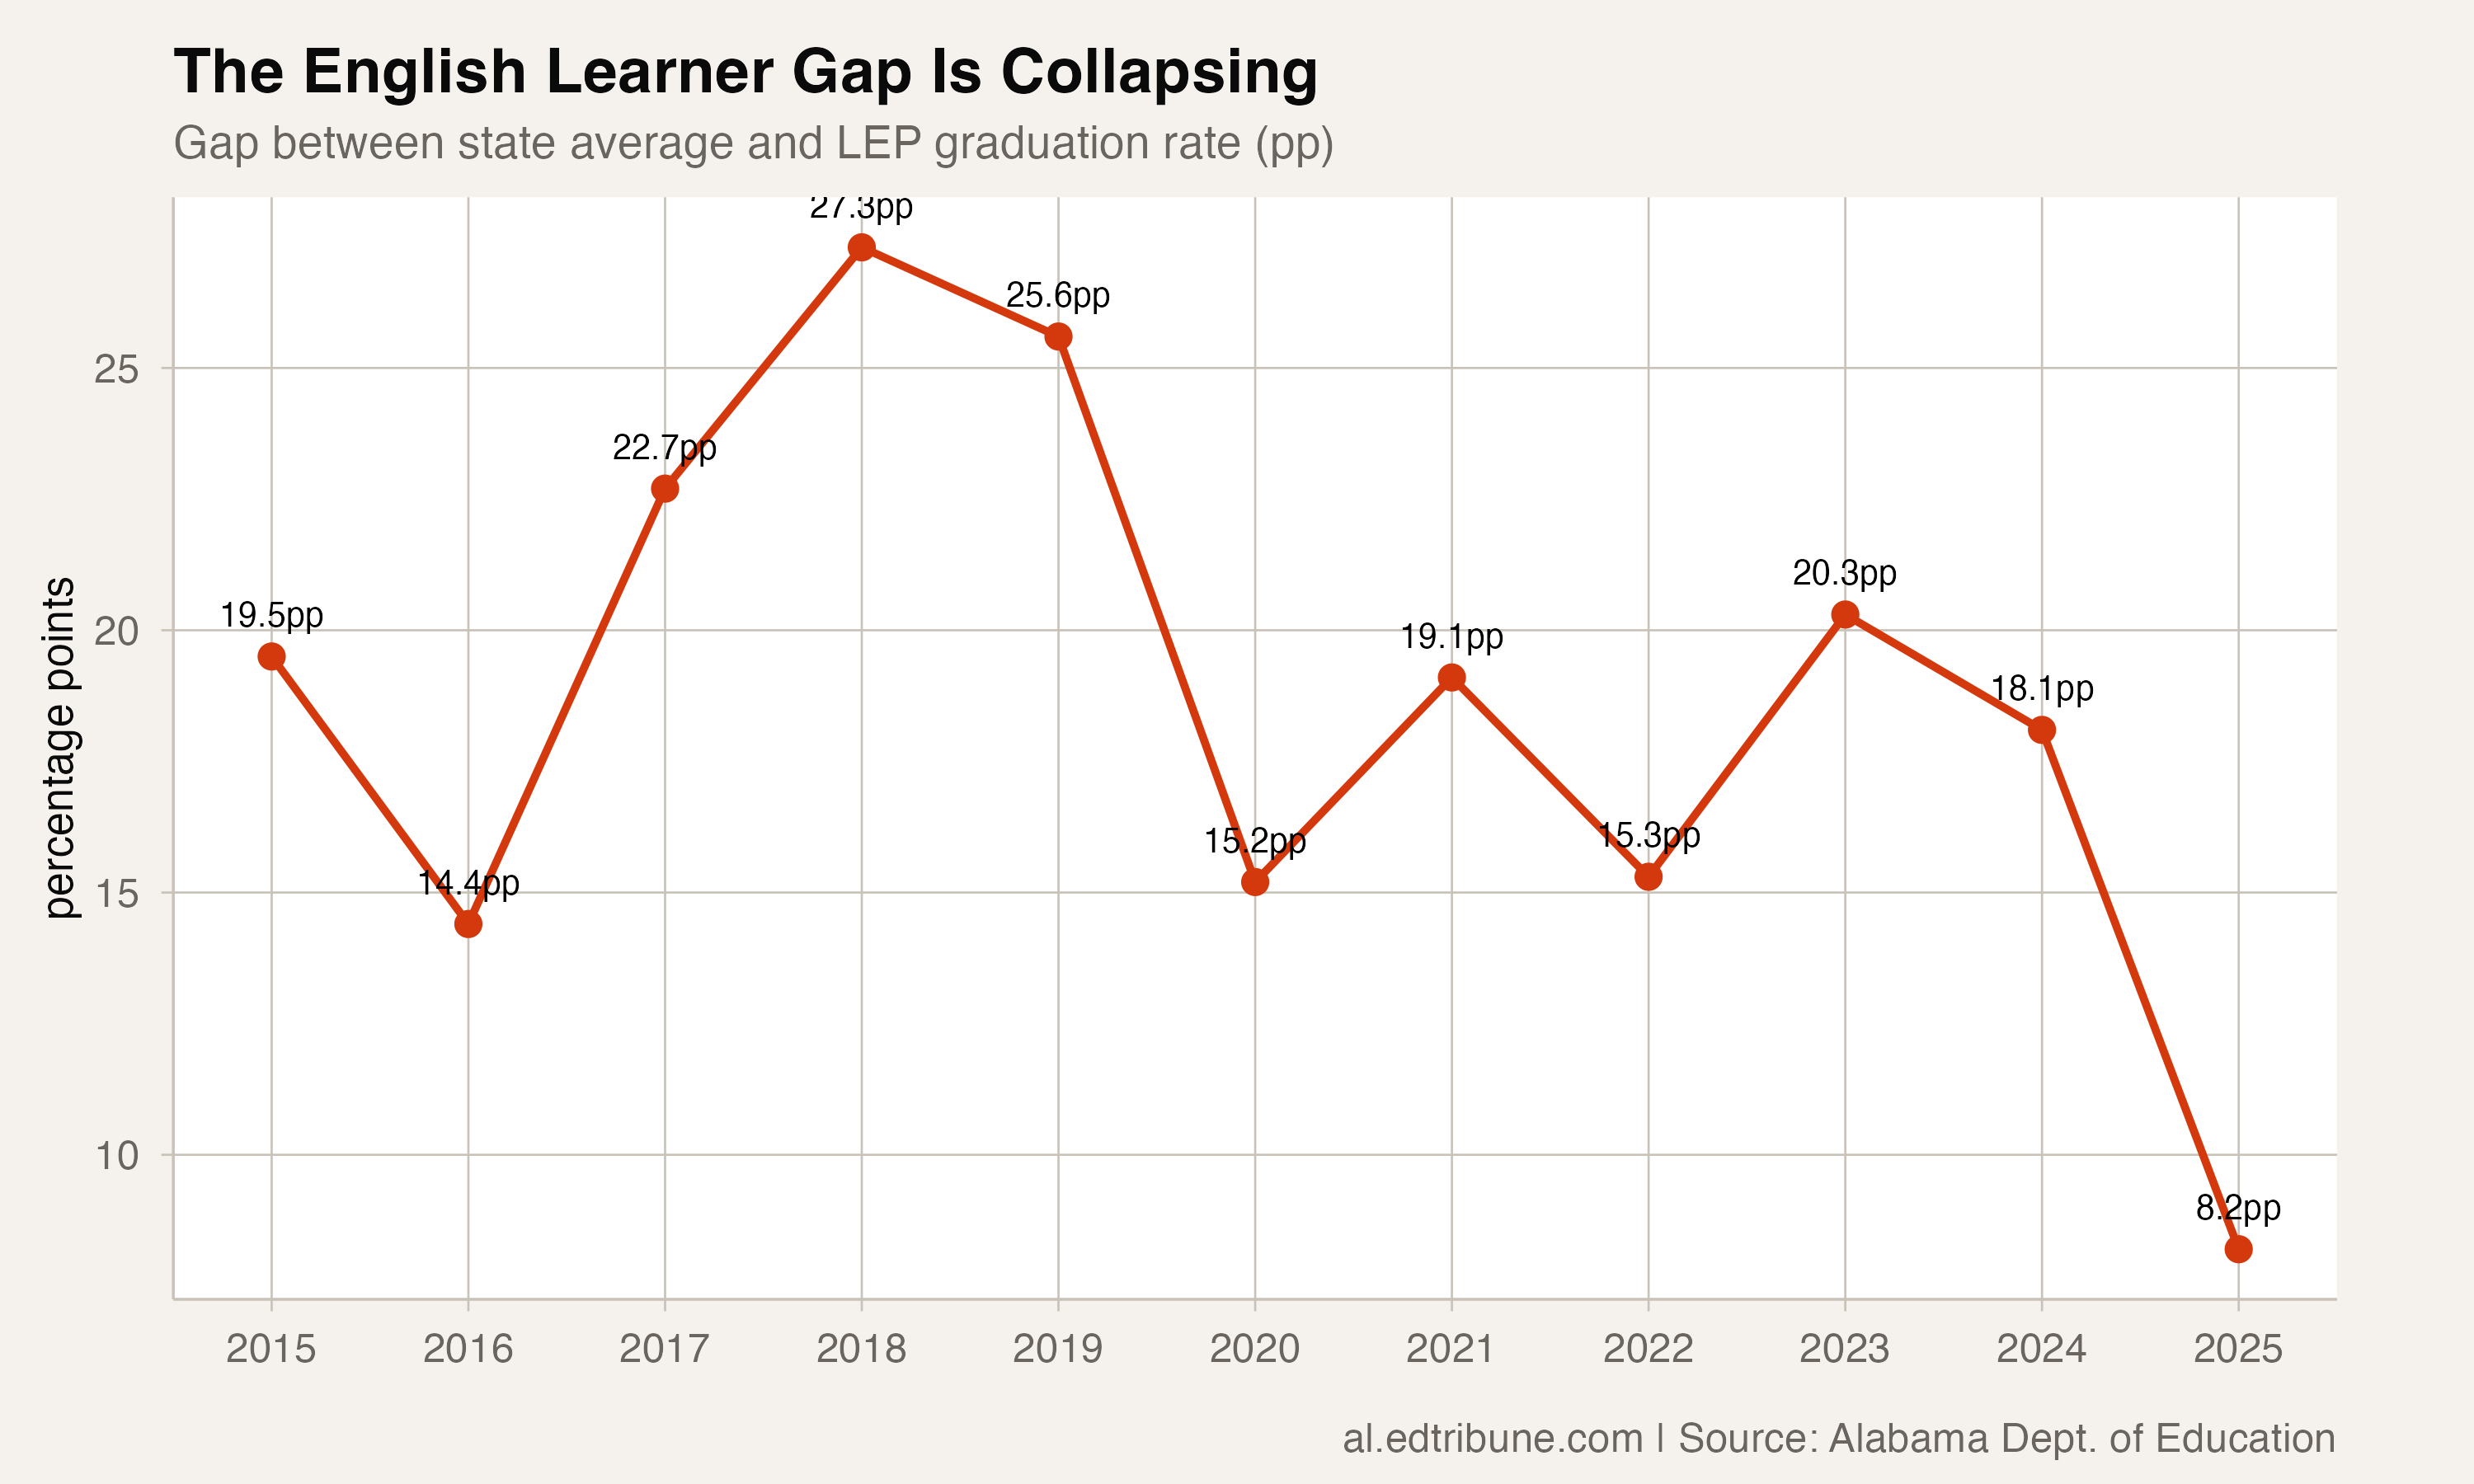
The 2024-2025 rebound erased the decline and then some. The 83.3 percent rate is 6.8 points above the previous high, and the gap to the state average has narrowed from about 19.5 points in 2015 to about 8.2 points in 2025.
Fastest improvement of any group
The 15.4-point two-year gain outpaced every other subgroup. Students in special education improved 4.9 points. Students who are economically disadvantaged gained 5.3 points. The overall rate gained 3.4 points. Students who are English learners improved at more than four times the statewide pace.
What could explain it
Several factors may have converged. Alabama has invested in dual-language programs and expanded instructional supports for students who are learning English, particularly in districts with growing immigrant populations like those in the poultry-processing belt of north Alabama. Federal accountability requirements under ESSA also pushed states to report and improve the graduation rate for English learners as a distinct indicator.
The 2023 dip and subsequent rebound also suggest that the temporary grading and attendance flexibilities of 2020-2022 may have masked underlying challenges for students who are learning English, which became visible in 2023 when those supports ended. The 2024-2025 gains may reflect schools adapting their support for English learners to a post-COVID reality rather than reverting to pre-COVID practices.
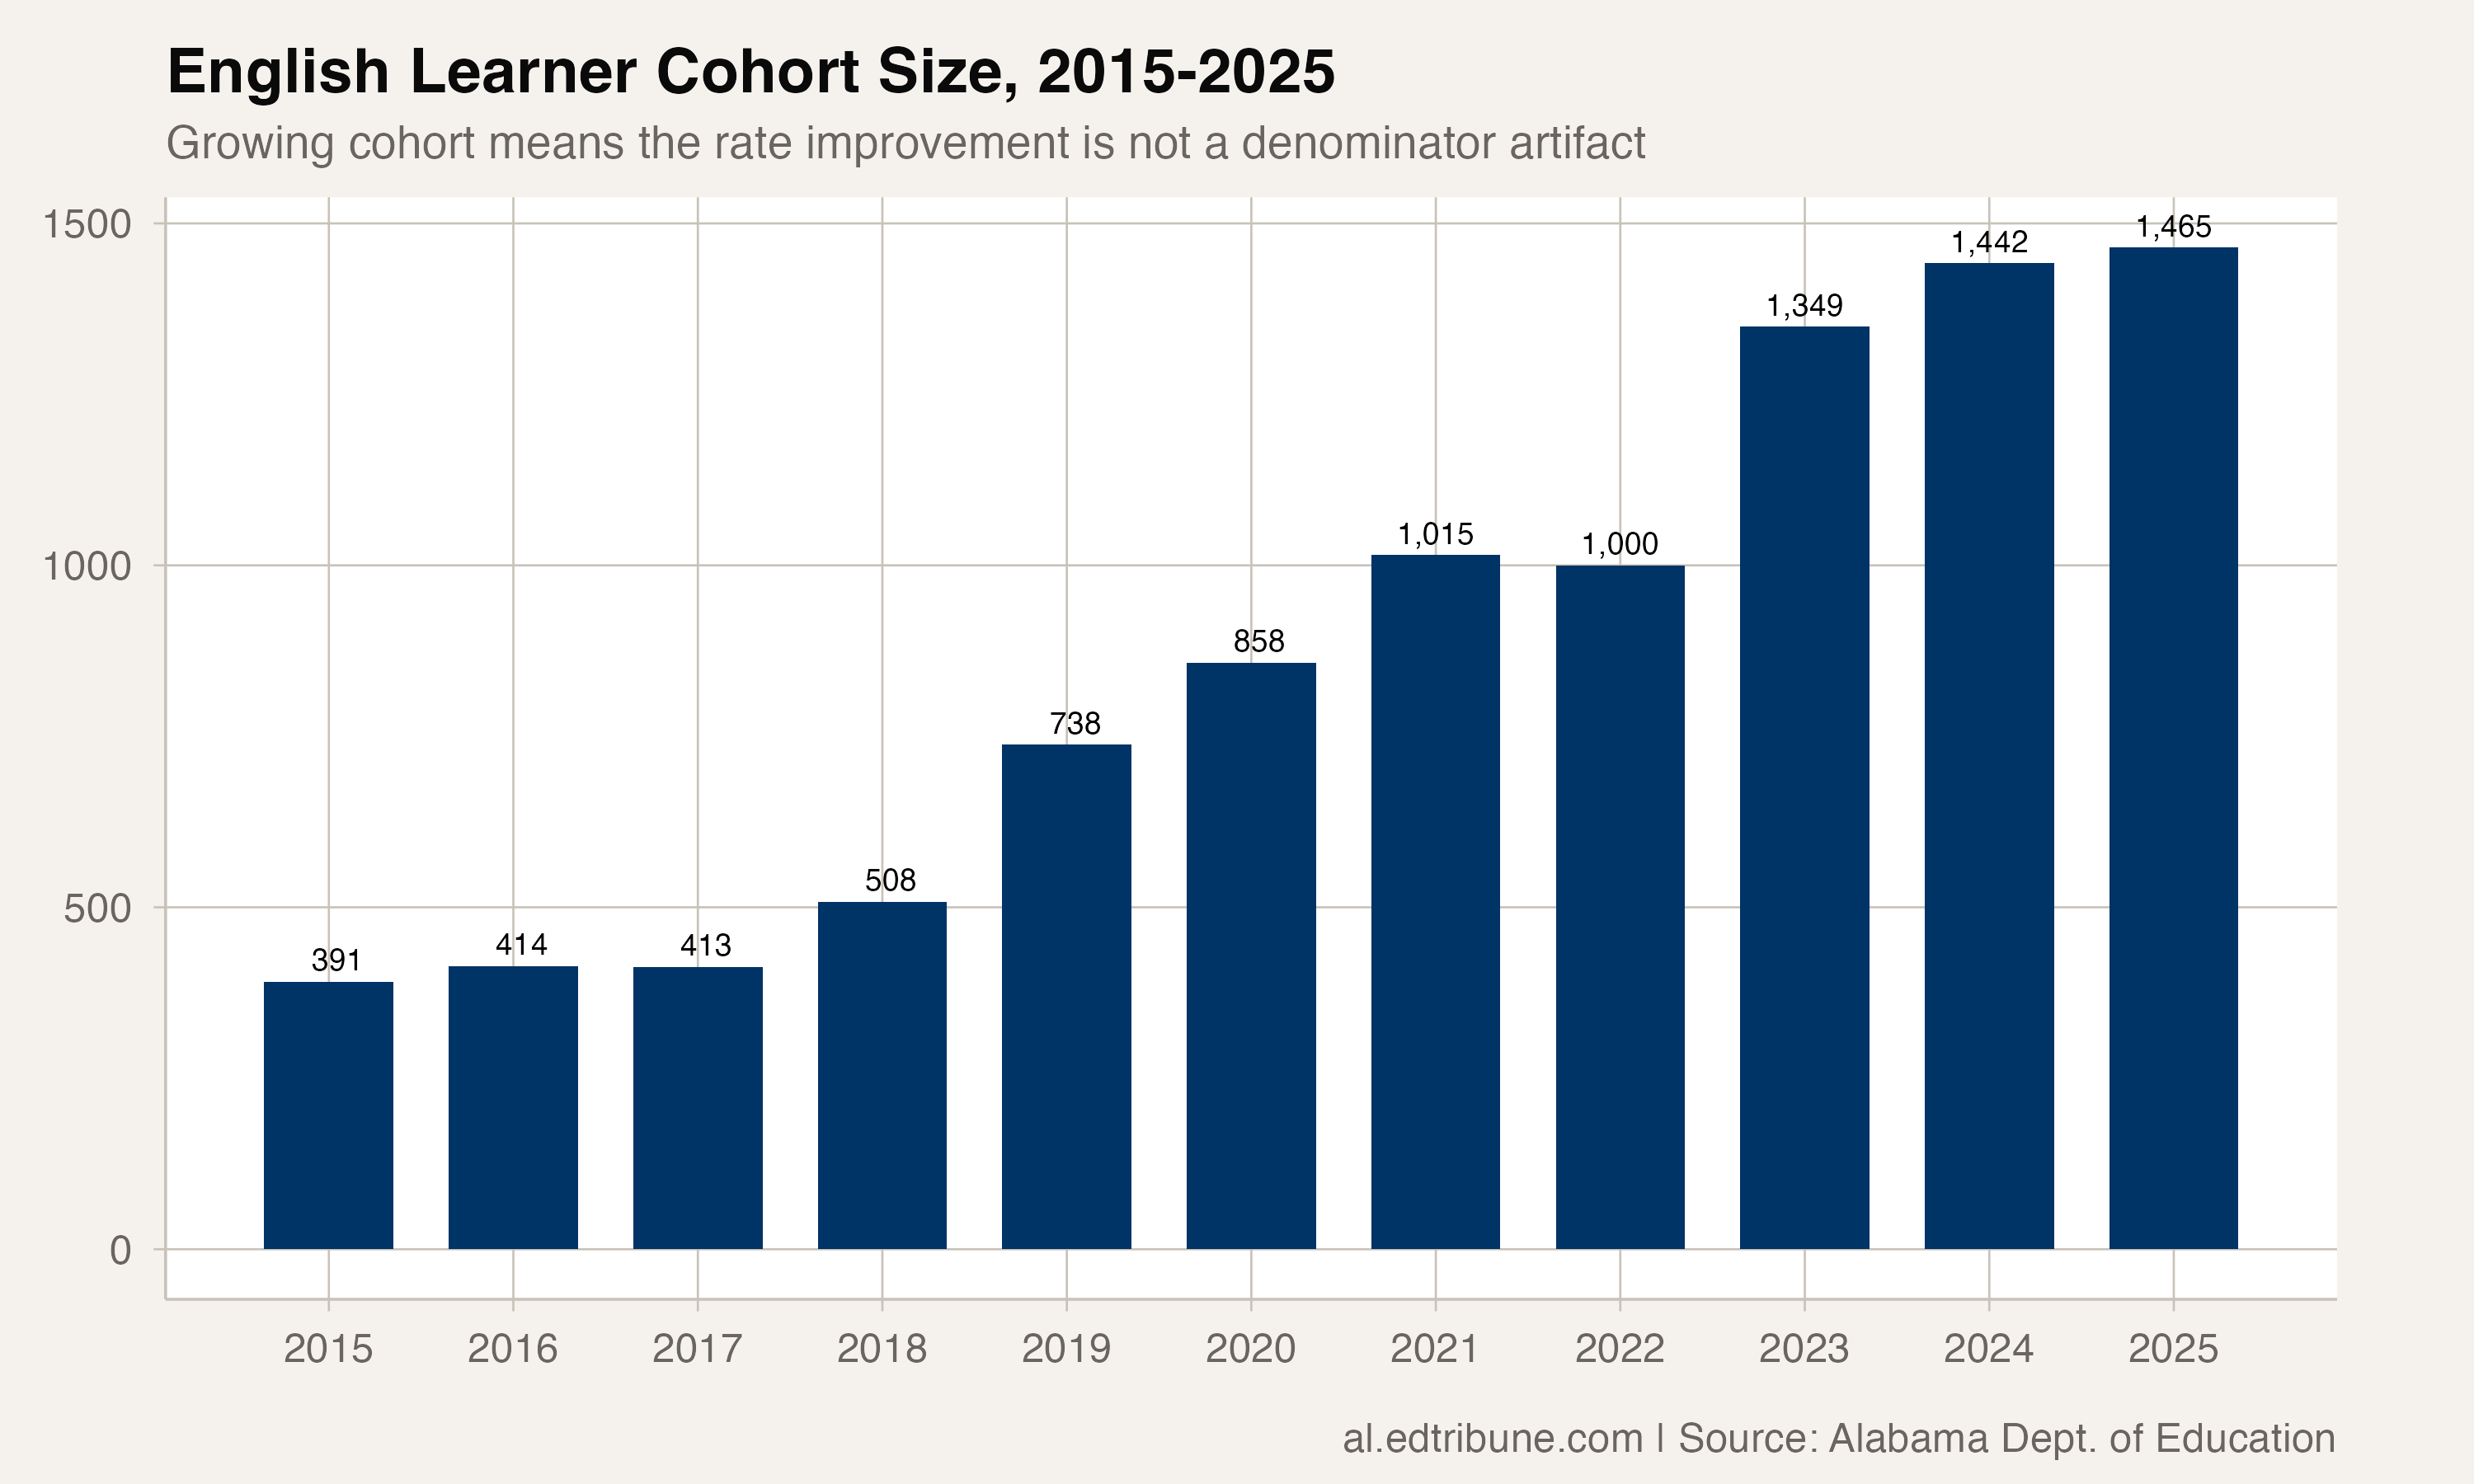
The cohort is also growing. The number of English learners in each graduating class has increased over the decade, which means the improvement is not an artifact of a shrinking denominator.
The volatility question
The same volatility that produced a 15-point improvement can produce a 15-point decline. The rate fell 8.6 points from 2020 to 2023, then rebounded 15.4 points over the next two years. Only a couple of other groups, including migrant and special education students, show comparable year-to-year swing.
The pattern suggests that the graduation rate for students who are learning English may be more sensitive to policy changes (grading flexibility, attendance policies, credit recovery access) than the rates for larger, more stable groups. If the 2025 rate reflects a lasting improvement in how schools serve these students, it should hold. If it reflects favorable conditions that could shift, the volatility will return.
By the numbers: 83.3% is the graduation rate for Alabama students who are English learners in 2025, up from 67.9% in 2023. The 15.4 percentage point two-year gain is the largest of any subgroup. The gap to the state average has narrowed from about 19.5pp to about 8.2pp.
Detailed code that reproduces the analysis and figures in this article is available exclusively to EdTribune subscribers.
Discussion
Sign in to join the discussion.
Loading comments...