Alabama Graduation Rates: Nine Records · 2023 CrashET · BirminghamET · Foster CareET · CCR GapET
Alabama's Class of 2025 did not produce a single record-breaking headline. It produced nine.
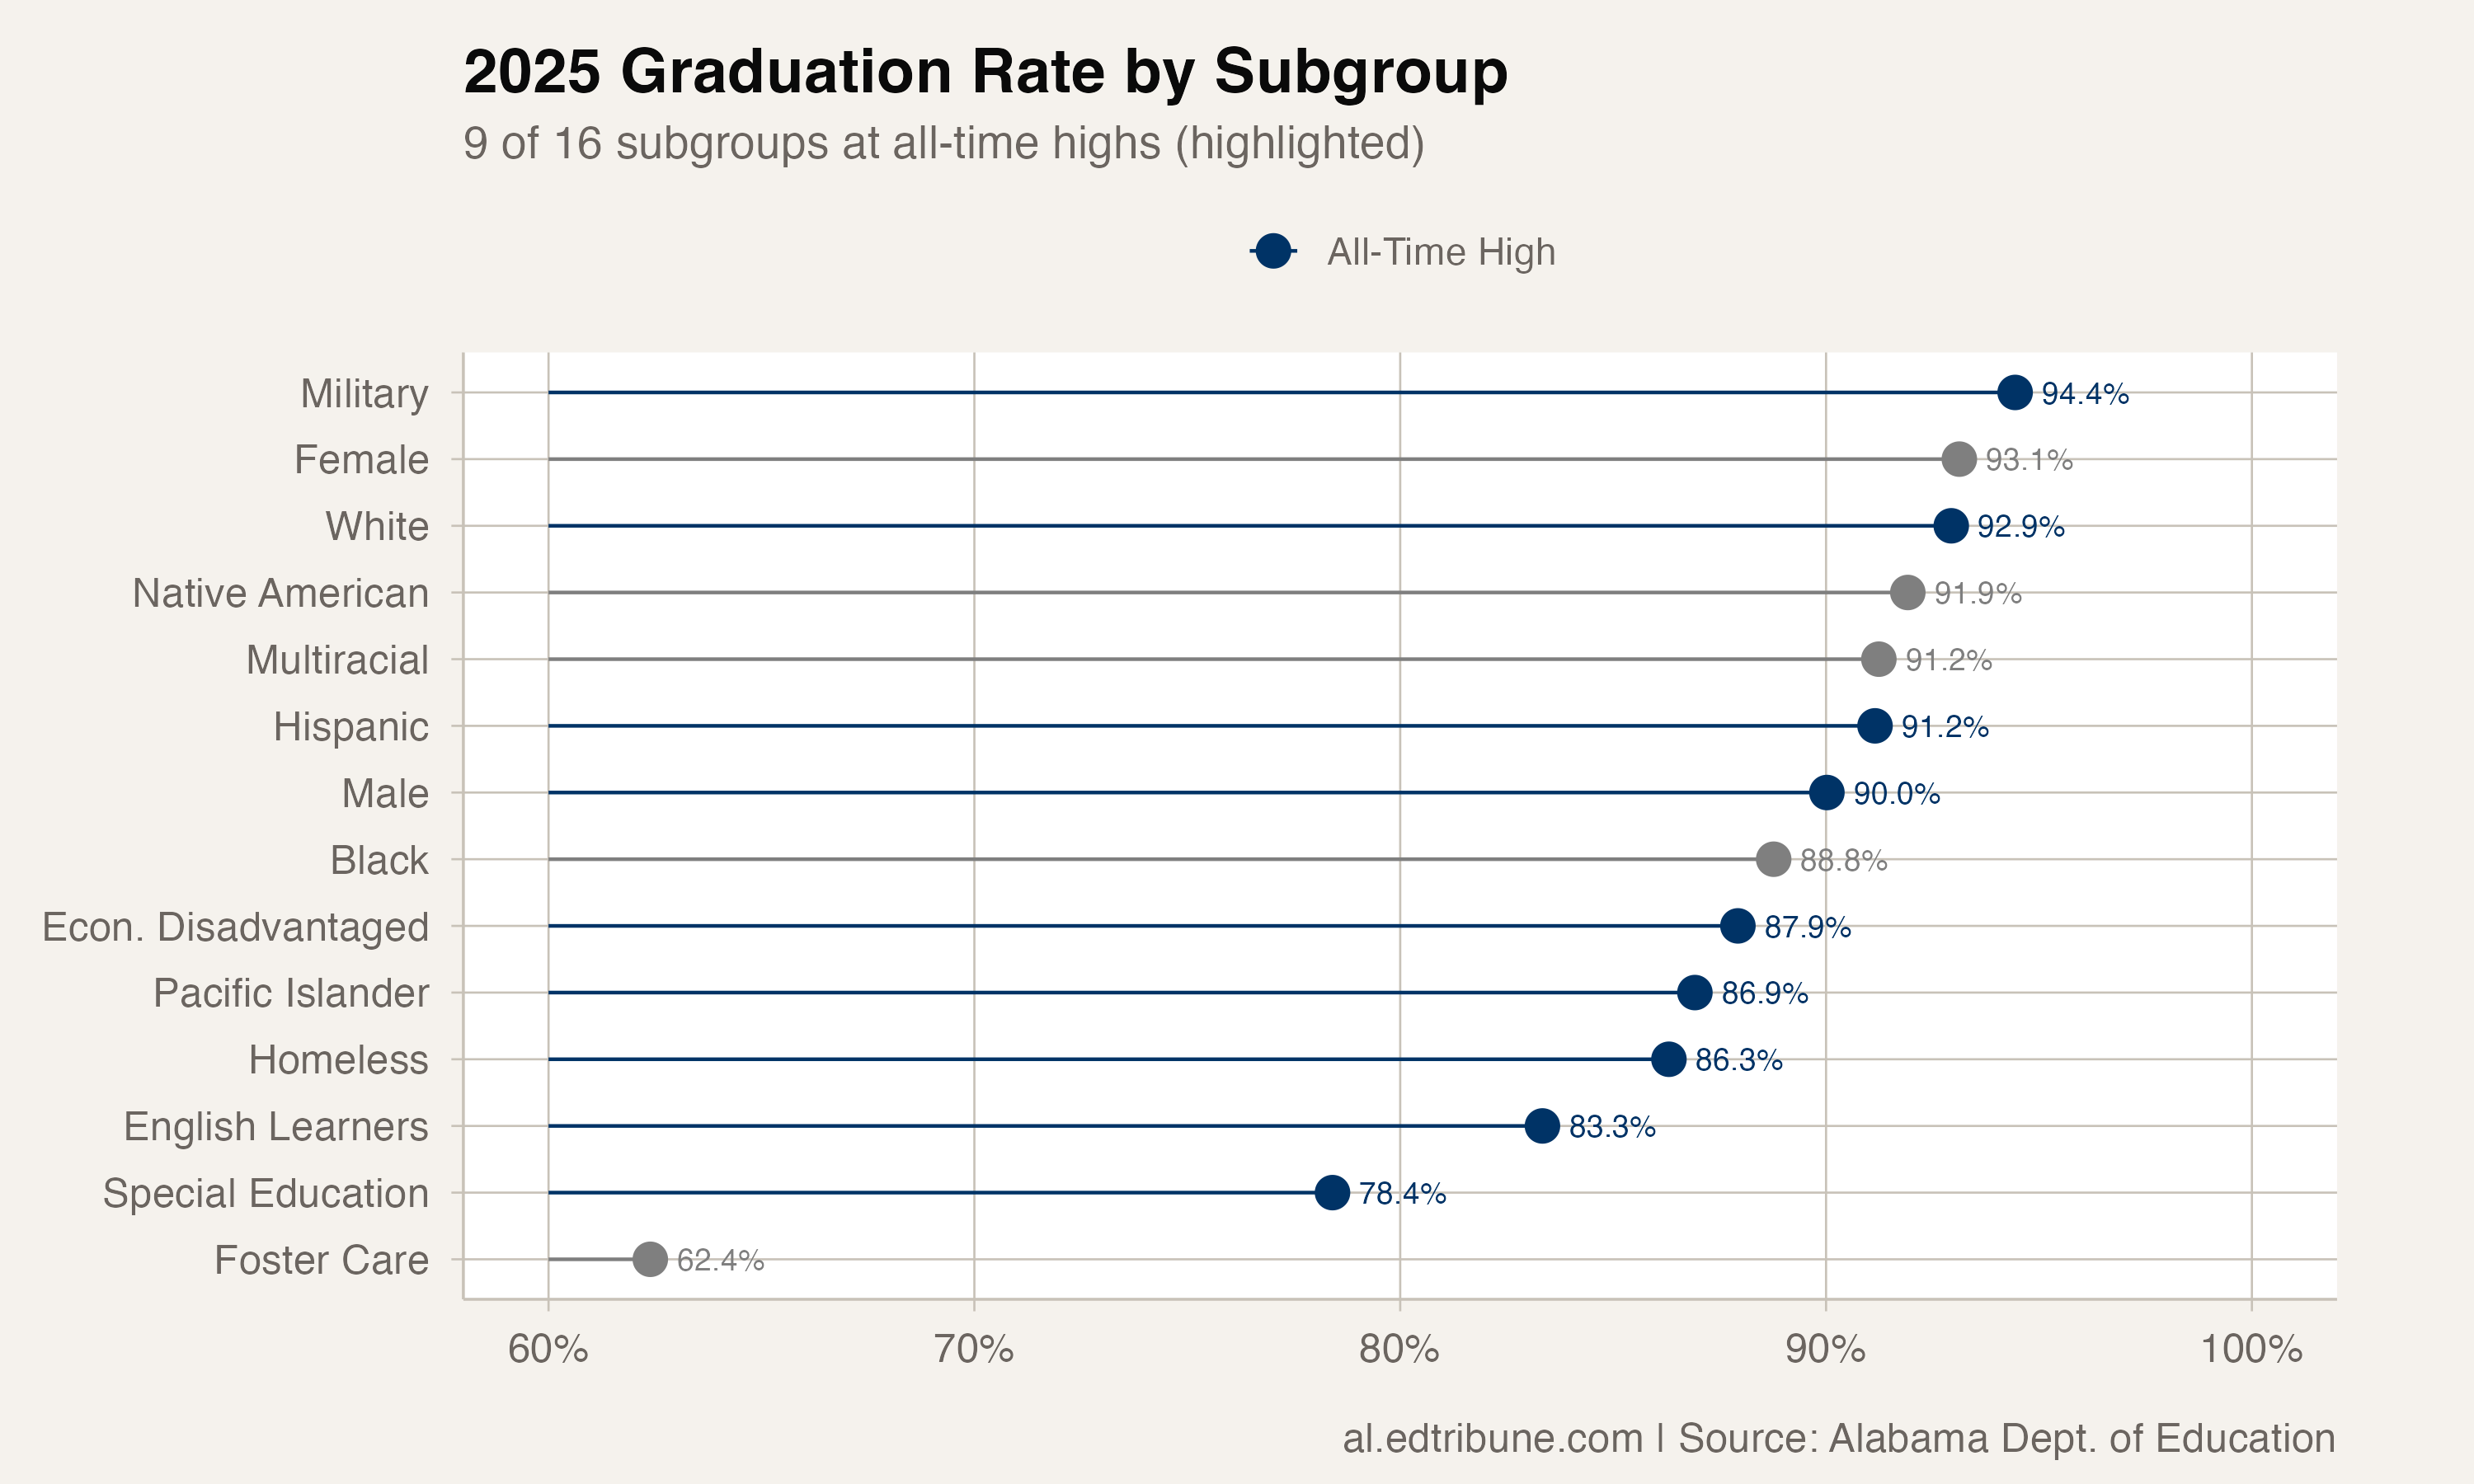
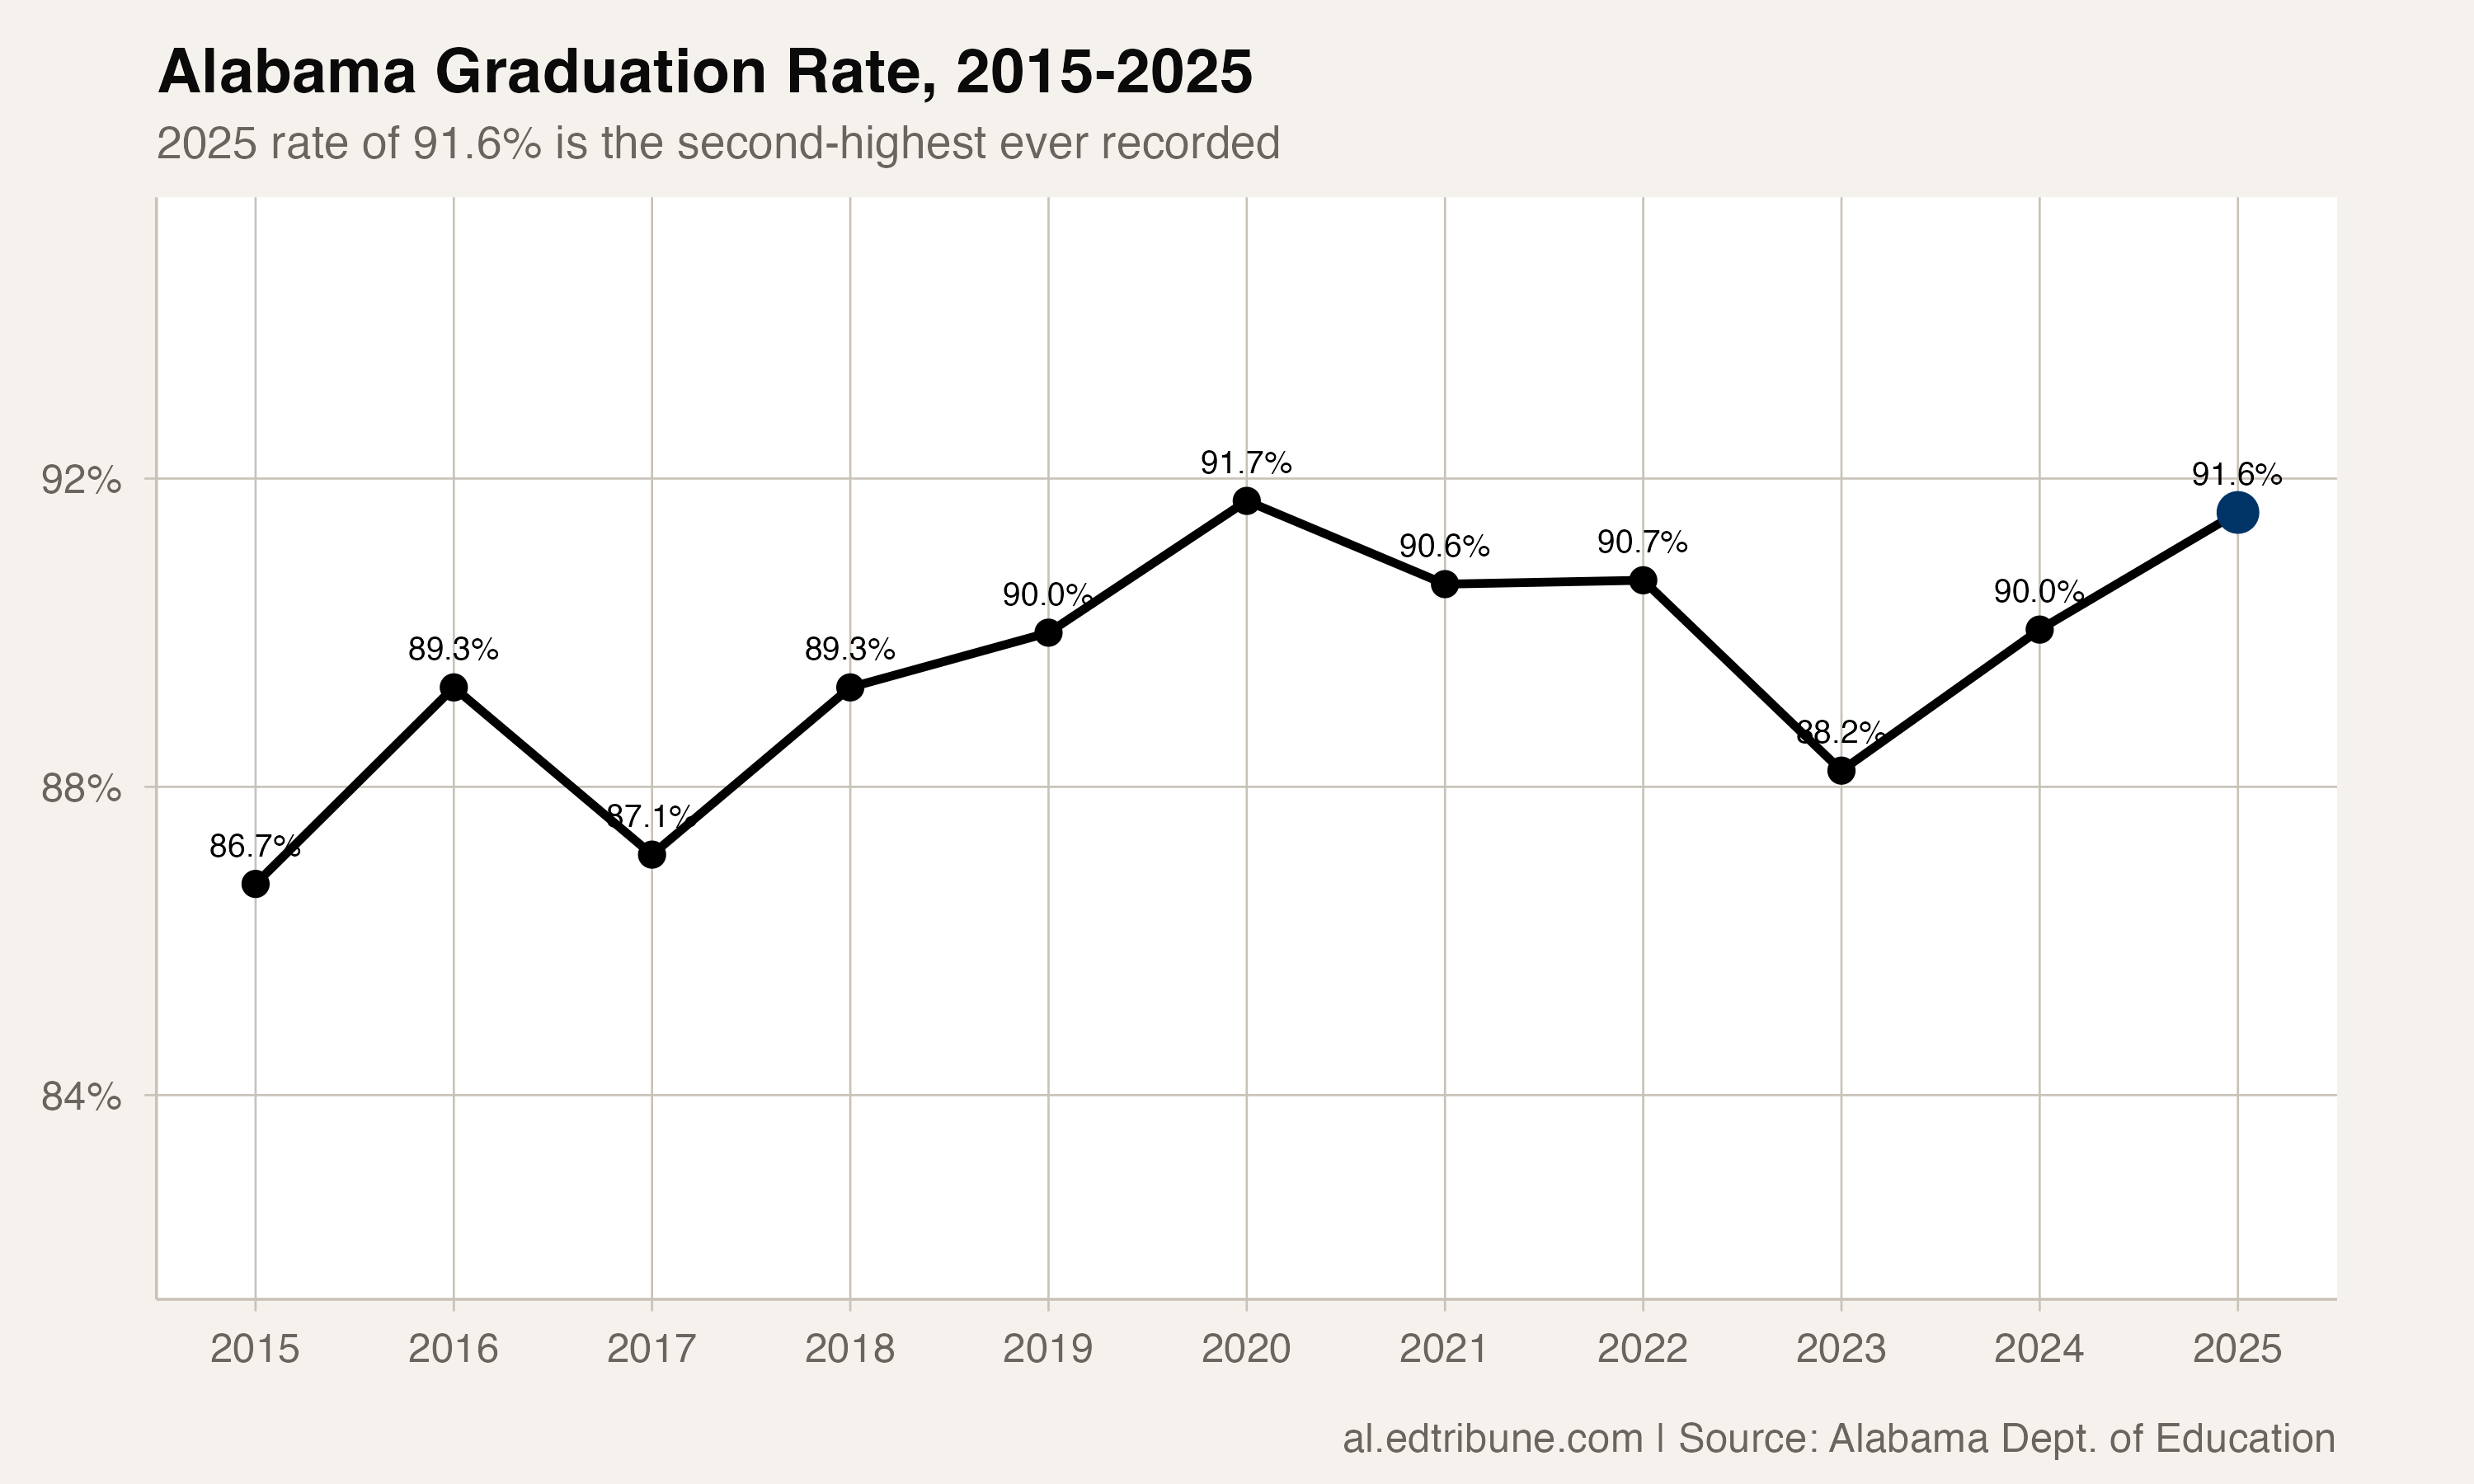
White students, Pacific Islander students, Hispanic students, male students, economically disadvantaged students, special education students, English learners, students who are currently homeless, and military-connected students all graduated at the highest rates ever recorded in the state. The overall rate of 91.6 percent is the second-highest on record, trailing only the 91.7 percent posted in 2020, a figure widely considered inflated by COVID-era grading and attendance policies.
The breadth of the 2025 results is what matters. This is not one demographic lifting the average. It is simultaneous progress across groups that share almost nothing in common except that schools have historically struggled to serve them.
Where each record stands
The headline numbers: economically disadvantaged students reached 87.9 percent, up from 82.0 percent a decade ago. Special education students hit 78.4 percent, a nearly 12-point improvement since 2015. English learners climbed to 83.3 percent after a brutal 2023 when they fell to 67.9 percent. Students who are currently homeless posted 86.3 percent, erasing a 12-point deficit accumulated during the pandemic years.
Male students crossed 90 percent for the first time, reaching 90.0 percent and narrowing the gender gap to 3.1 percentage points, the smallest in the dataset. Military-connected students led everyone at 94.4 percent.
The groups that did not set records in 2025 are telling, too. Black students reached 88.8 percent, a strong showing but below their 2020 peak of 89.1 percent. Asian students had no reportable 2025 rate due to small sample sizes. And students in foster care, at 62.4 percent, are on the opposite trajectory entirely, declining every year since tracking began.
A decade of convergence
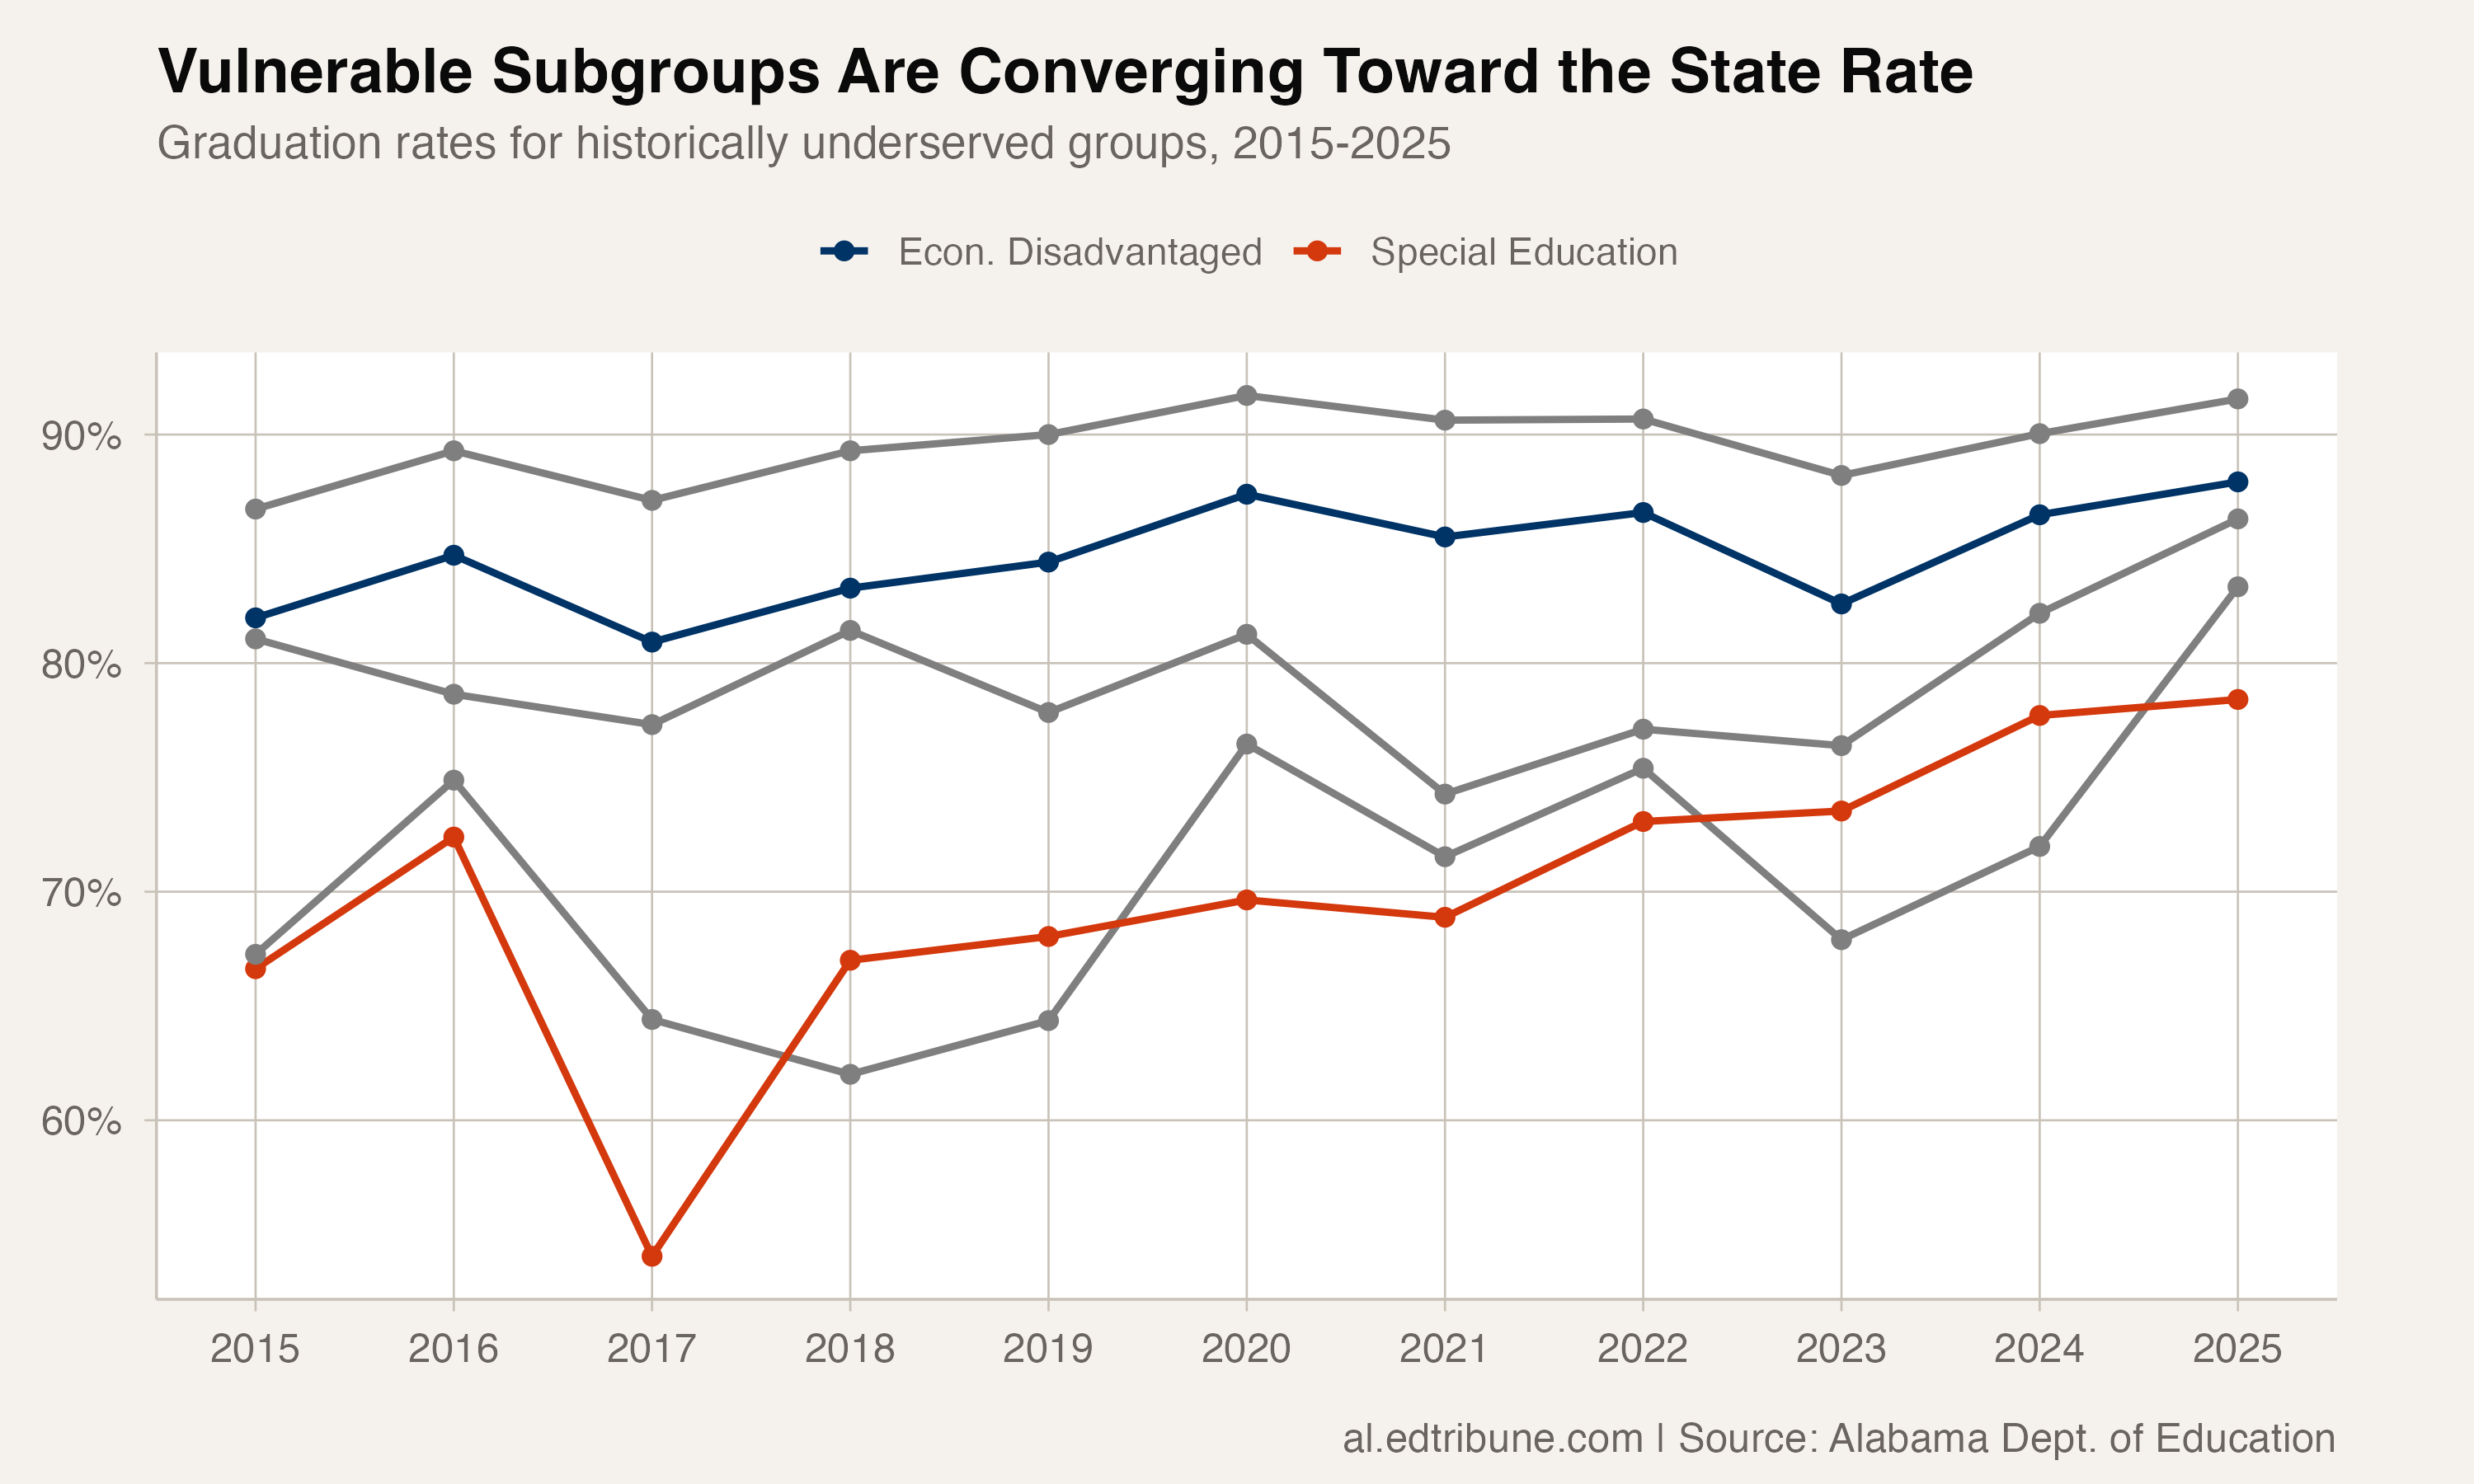
The most important pattern is not any single record but the narrowing distances between groups. In 2015, the gap between the overall rate and the special education rate was 20.1 percentage points. In 2025, it is 13.2. The gap for economically disadvantaged students shrank from 4.8 to 3.6 points. For English learners, from 19.4 to 8.3 points.
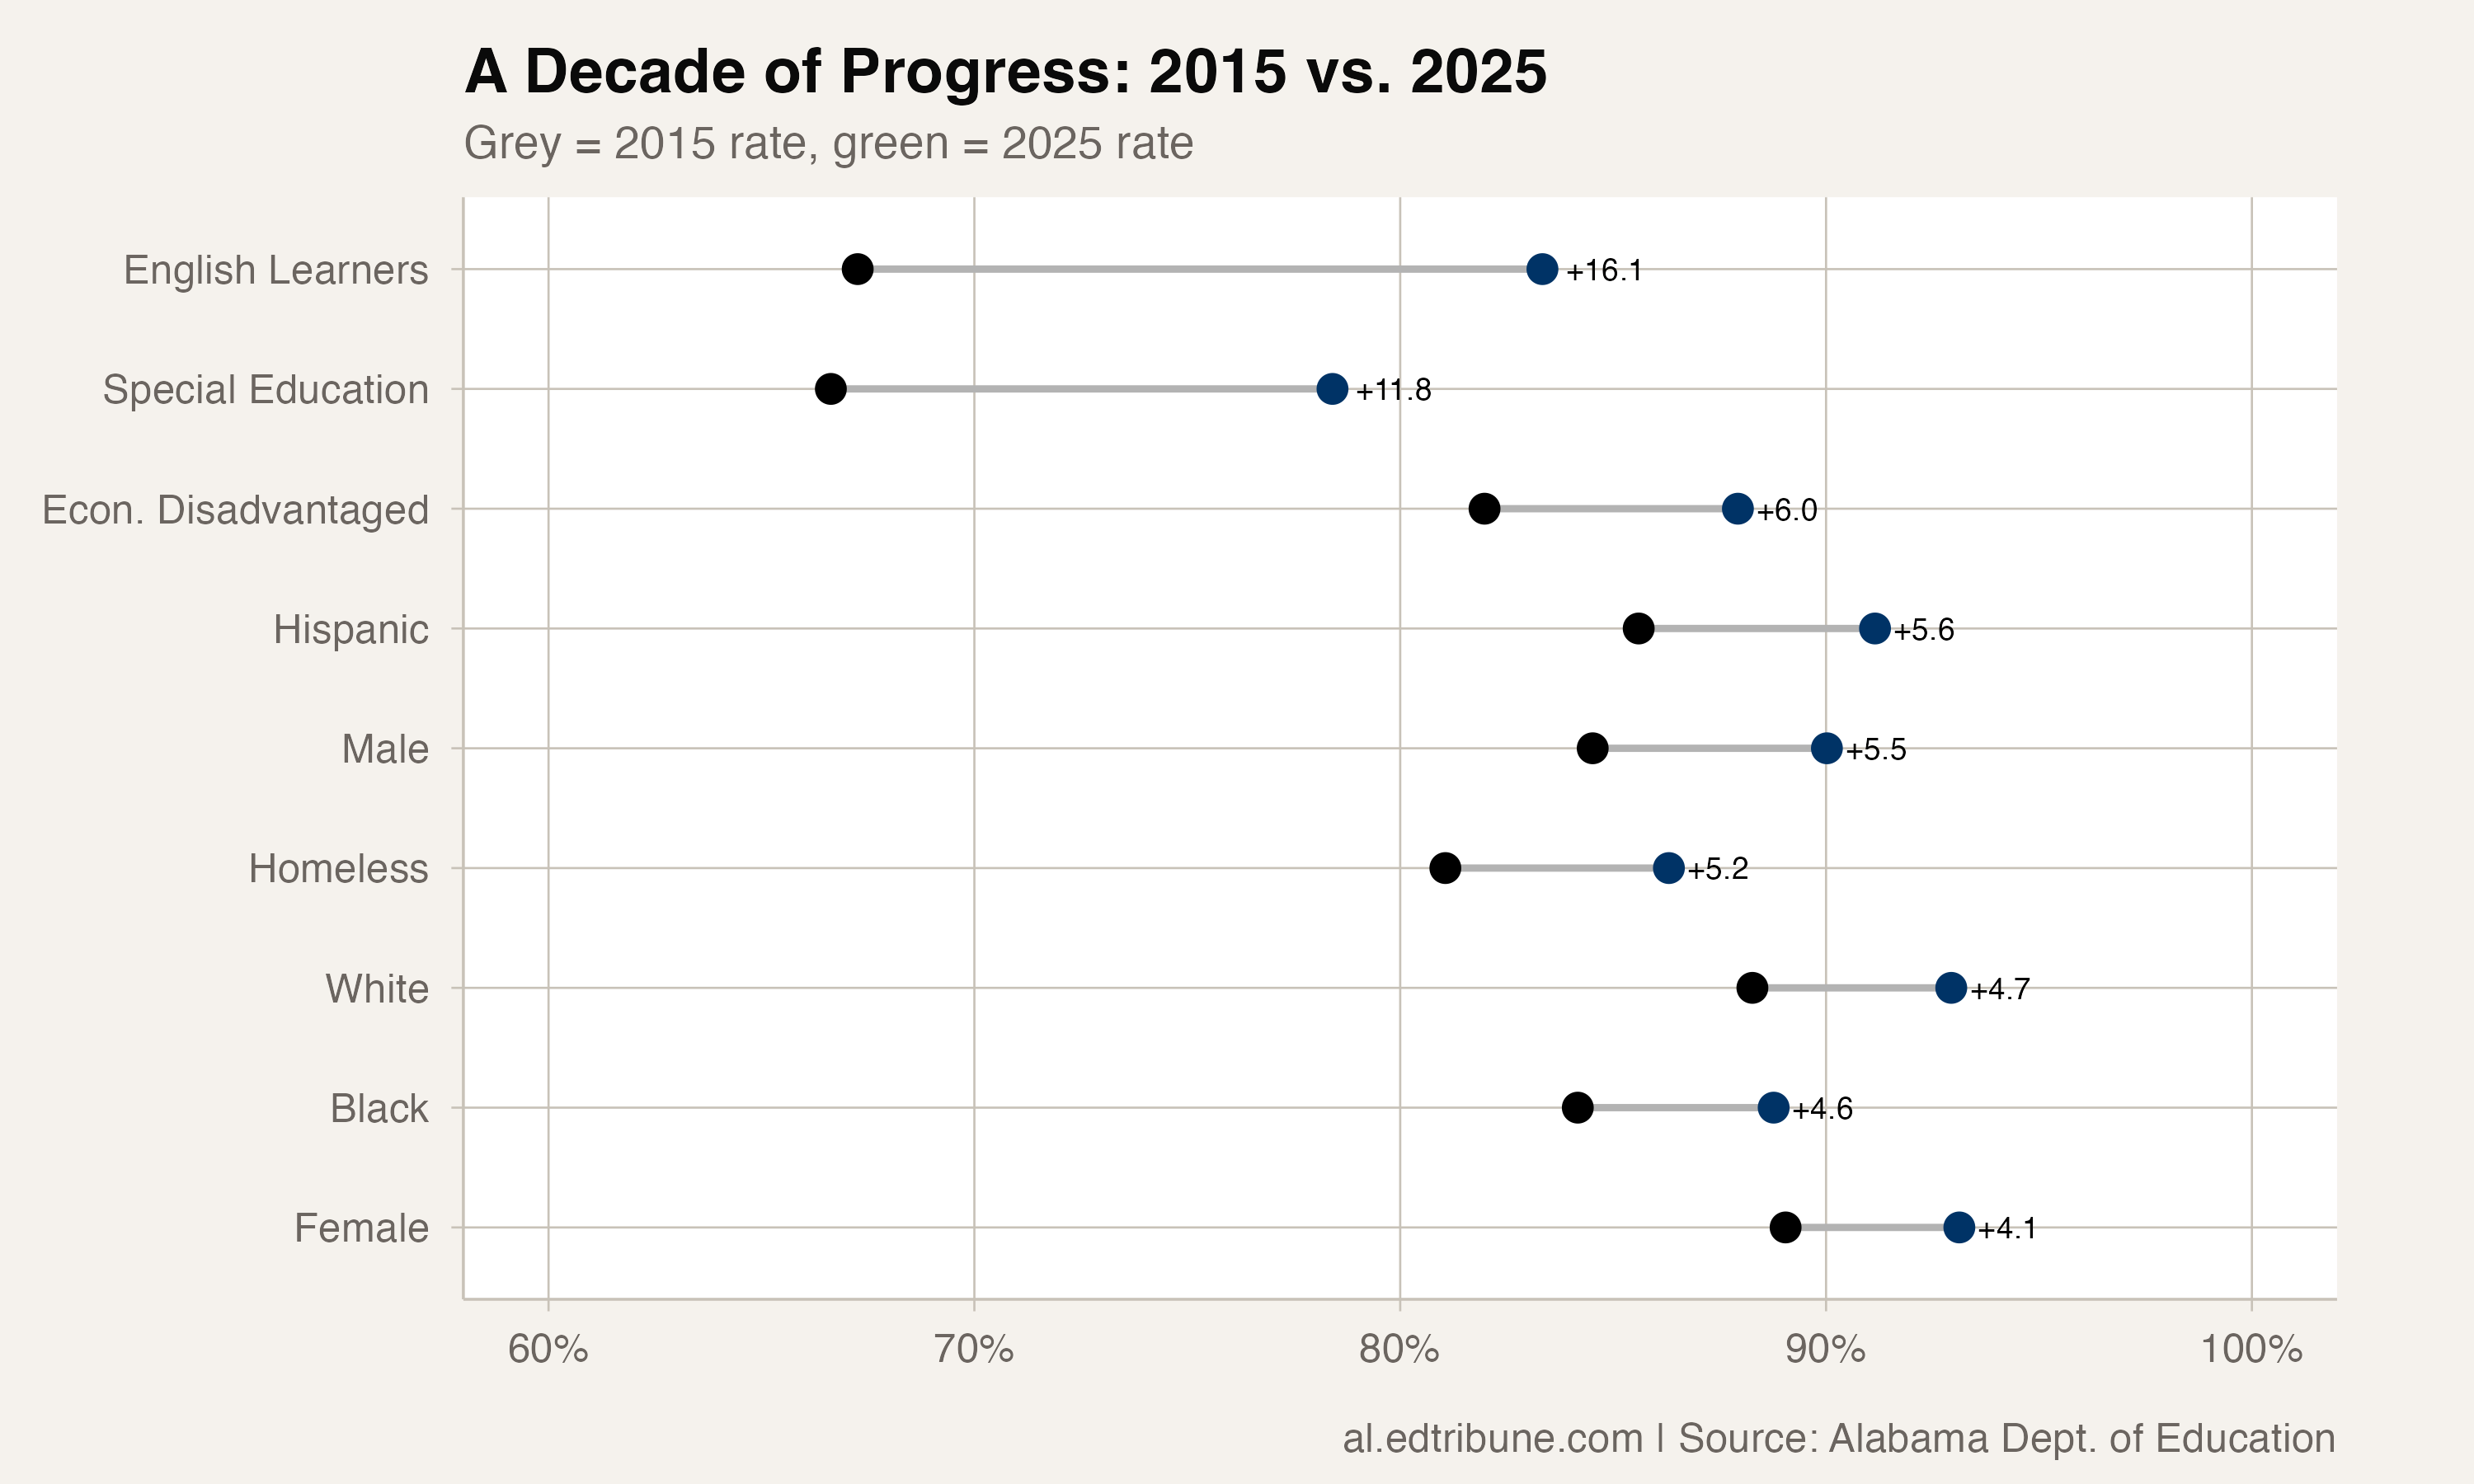
This convergence is happening because the groups that started lowest have improved the fastest. English learners gained 16.1 points over the decade. Special education students gained 11.8. Economically disadvantaged students gained 6.0. The overall rate gained 4.8, meaning every one of these groups outpaced the average.
The 2023 crash and the rebound
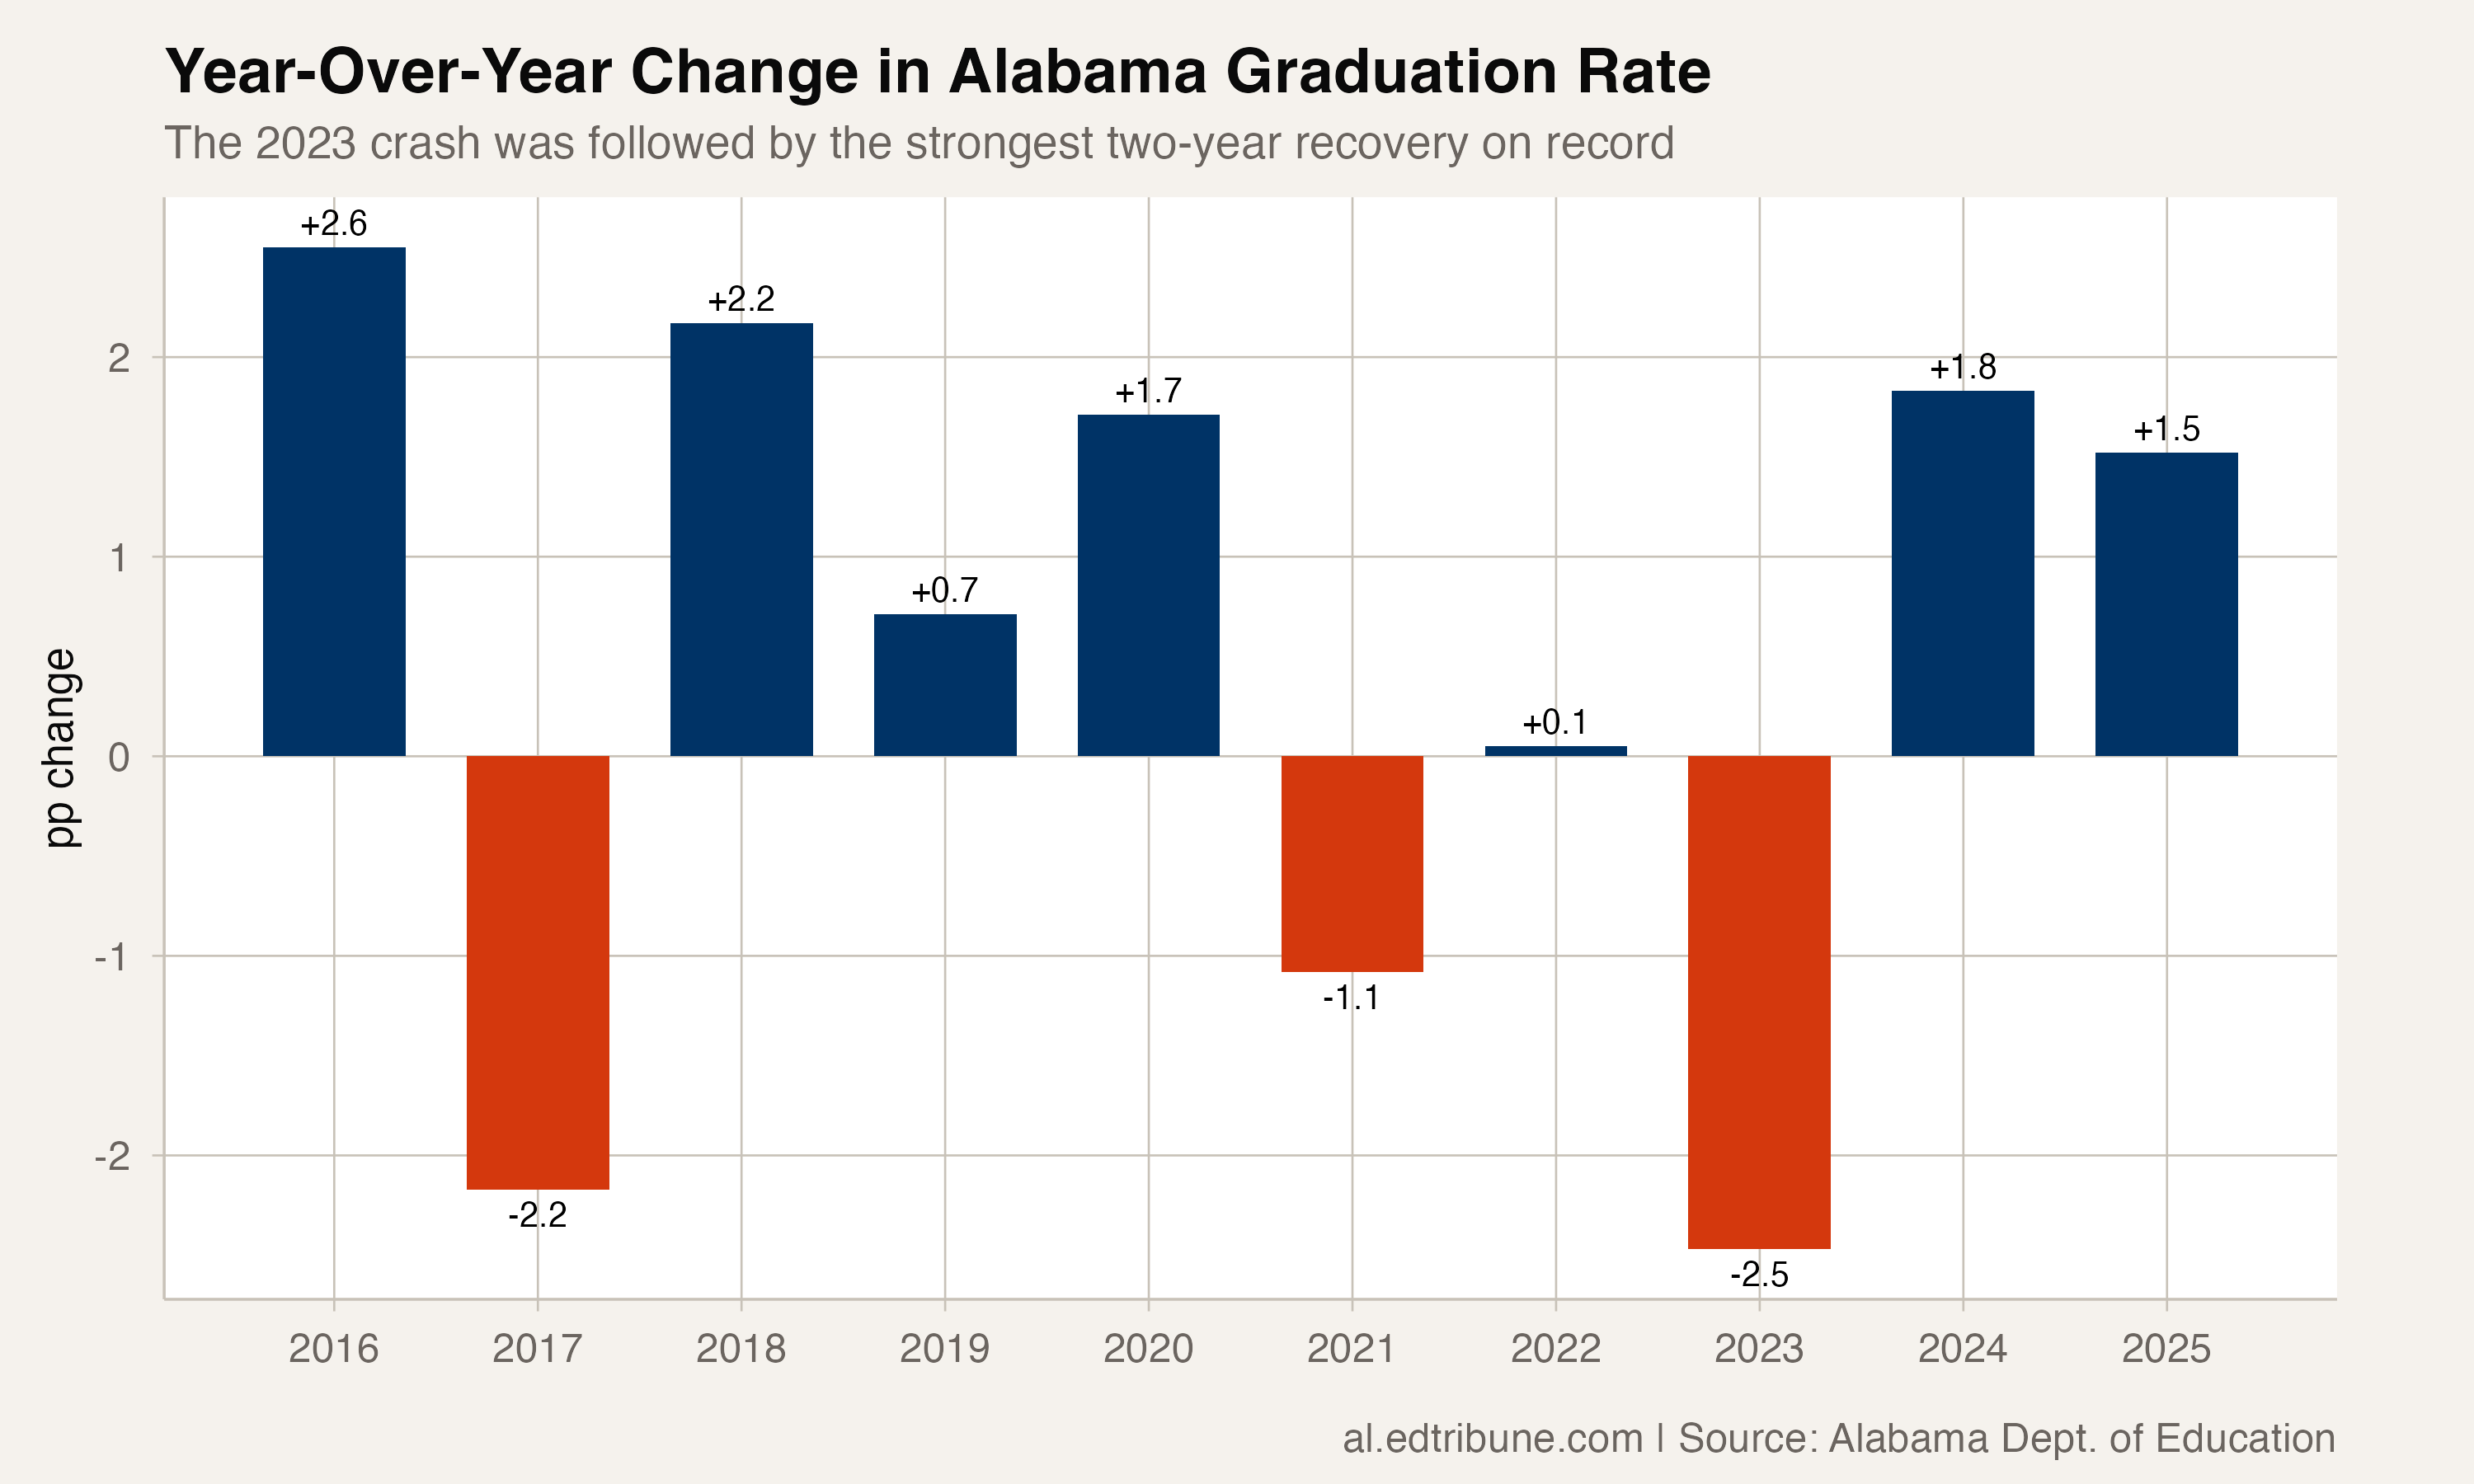
The path was not smooth. In 2023, Alabama's graduation rate dropped 2.5 percentage points in a single year, the sharpest decline in the dataset. Every subgroup fell except special education, which ticked up half a point. English learners took the hardest hit, falling 7.5 points. Students in foster care dropped 5.4 points. The crash was widely attributed to the expiration of COVID-era supports: flexible attendance policies, credit recovery programs, and relaxed graduation requirements.
The rebound over the next two years was equally dramatic. The state gained back 3.4 percentage points across 2024 and 2025, with English learners recovering 15.4 points, the fastest two-year improvement of any group.
What it does not mean
Nine records should not be confused with the absence of problems. The white-Black graduation gap sits at 4.2 percentage points in 2025, essentially unchanged from 4.1 points in 2015. Both groups improved in lockstep, never closing the distance. The foster care rate is in freefall. And the state's overall rate, at 91.6 percent, still means roughly 5,000 students did not receive a diploma with their cohort.
But in a year when education data nationally skews toward decline and crisis, Alabama produced something unusual: broad-based, simultaneous improvement across the groups most at risk of being left behind.
By the numbers: 9 of 16 subgroups at all-time highs in 2025. The largest gains over the decade: English learners +16.1pp, special education +11.8pp, economically disadvantaged +6.0pp.
Detailed code that reproduces the analysis and figures in this article is available exclusively to EdTribune subscribers.
Discussion
Sign in to join the discussion.
Loading comments...