Alabama Graduation Rates: 2023 CrashET · BirminghamET · Black Belt · CCR GapET · Conecuh · Foster CareET · Gender Gap · Hispanic Gap · Homeless · English LearnersET · MontgomeryET · Nine RecordsET · Phenix City · Special Ed · Race Gap
The Alabama Black Belt (the crescent of historically impoverished, majority-Black rural counties stretching from Sumter to Macon) is supposed to move as one. Same demographics. Same poverty. Same distance from state resources. Same story.
The graduation data says otherwise.
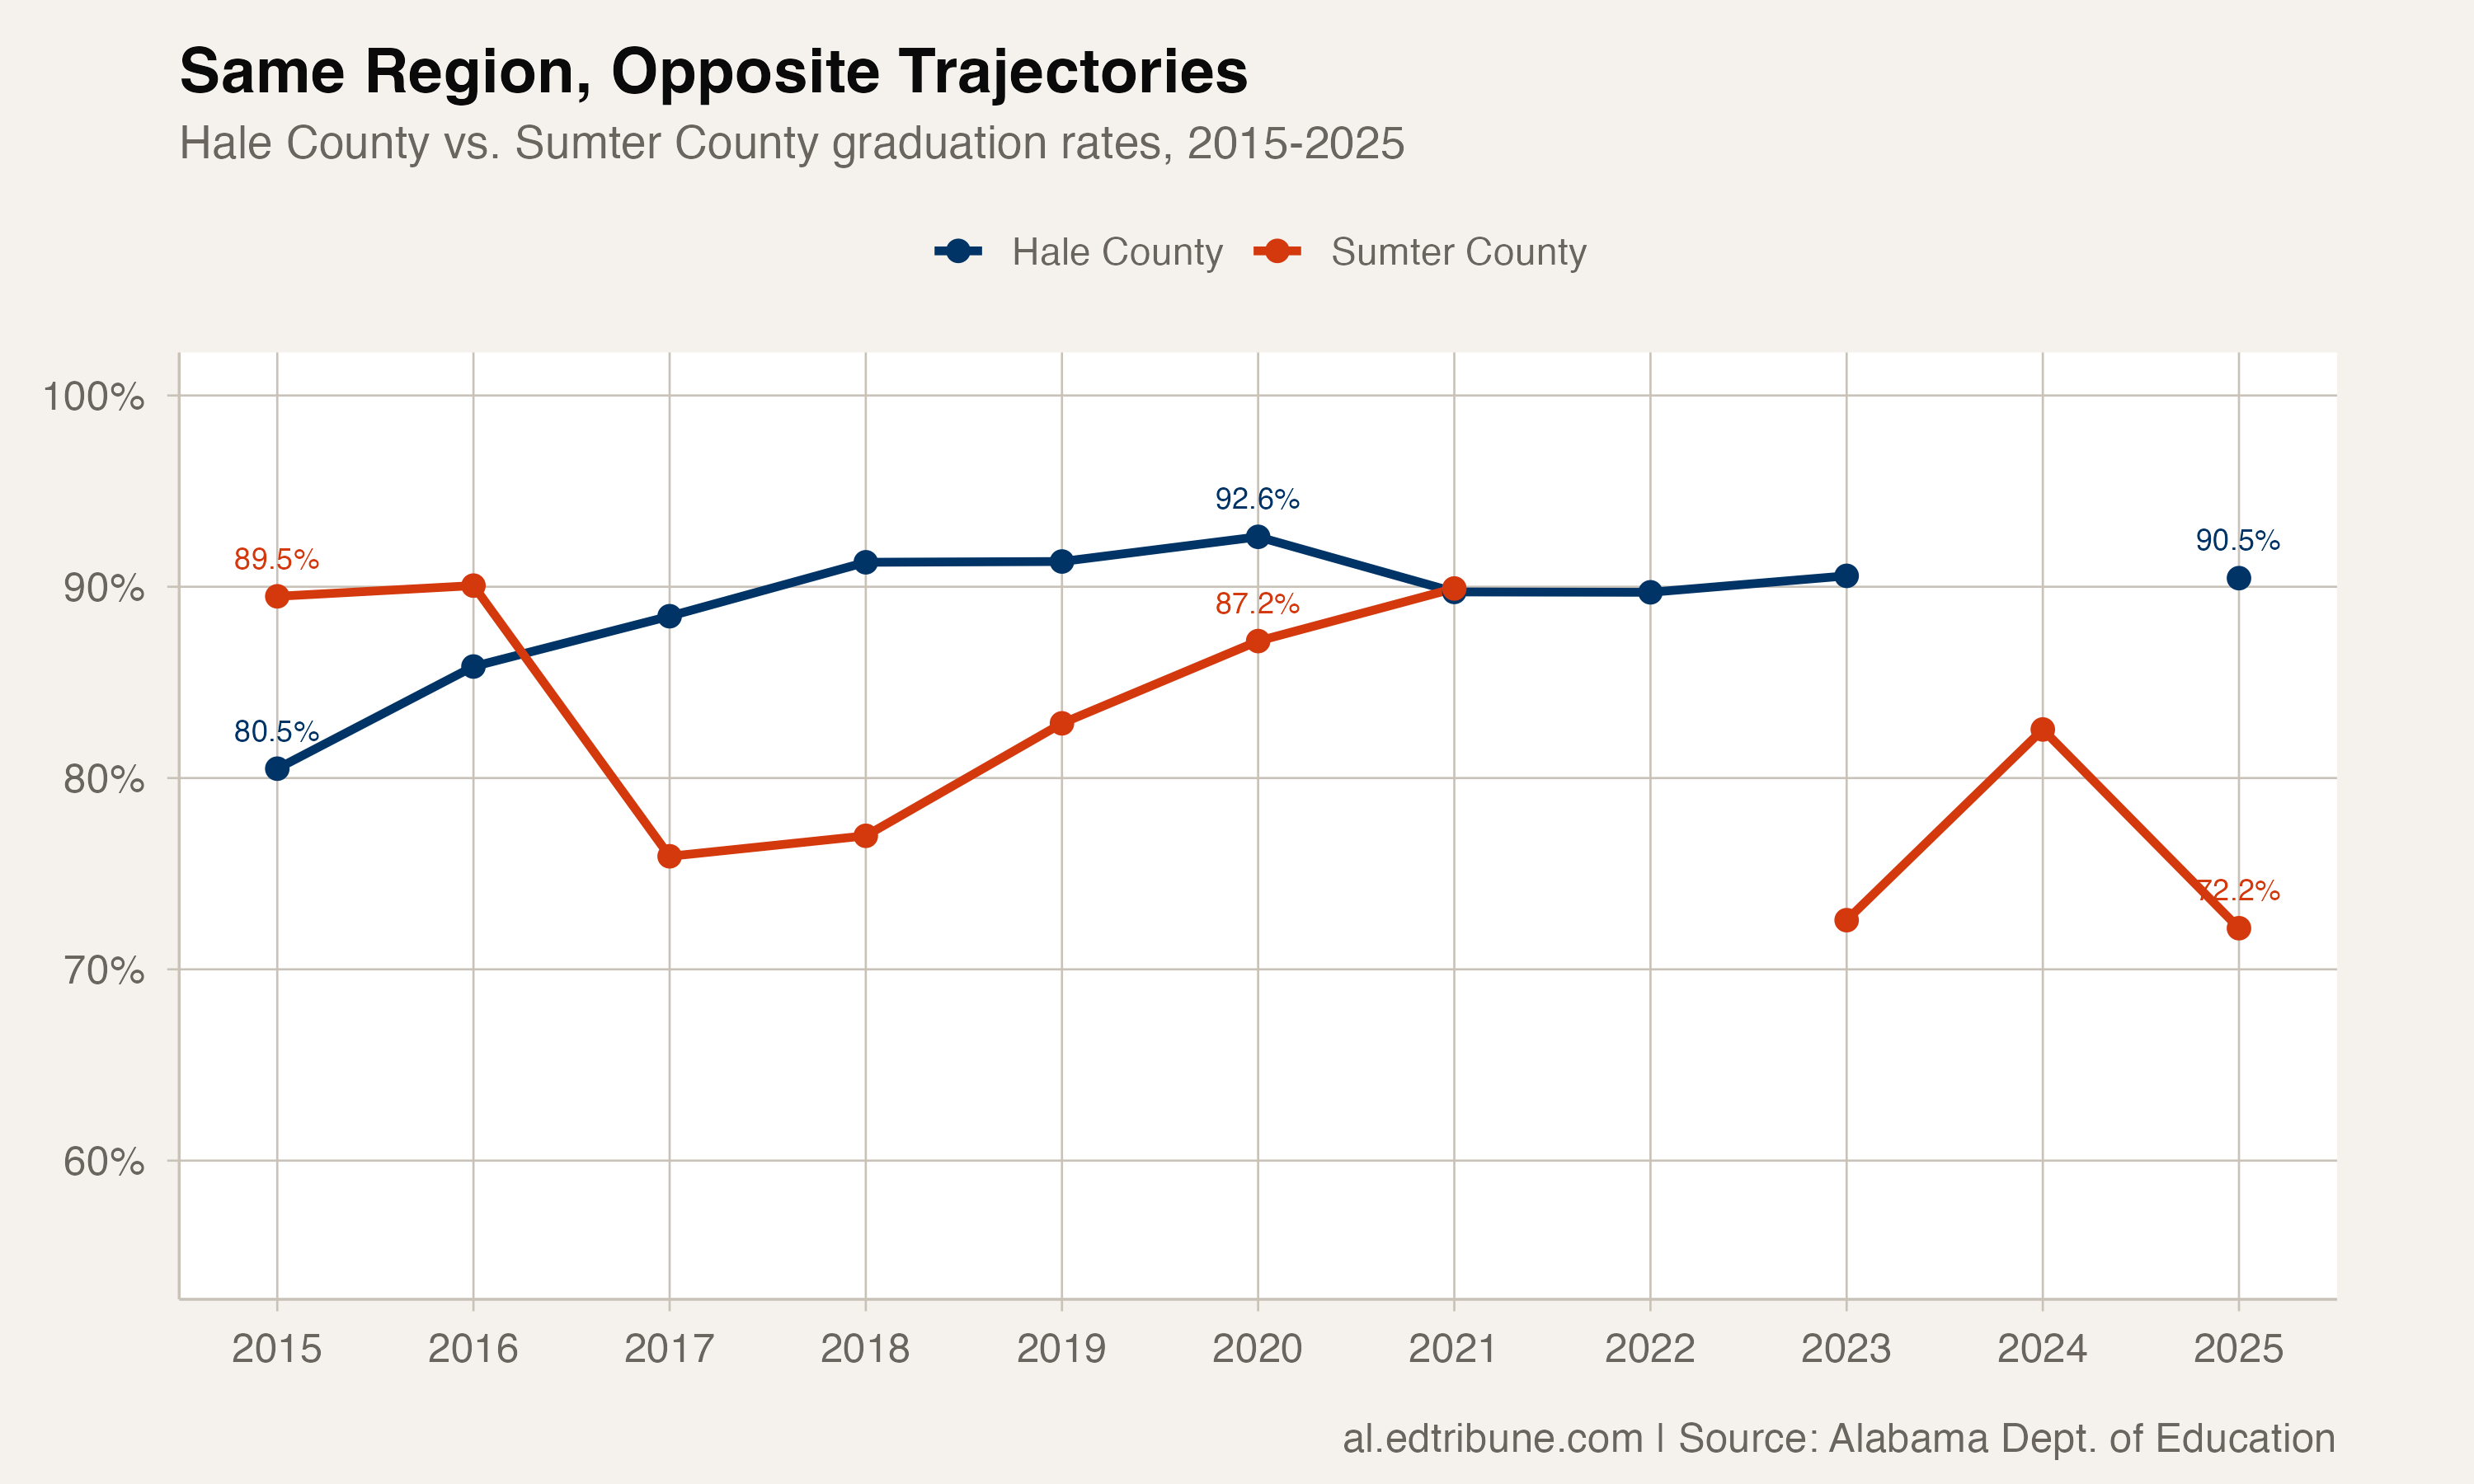
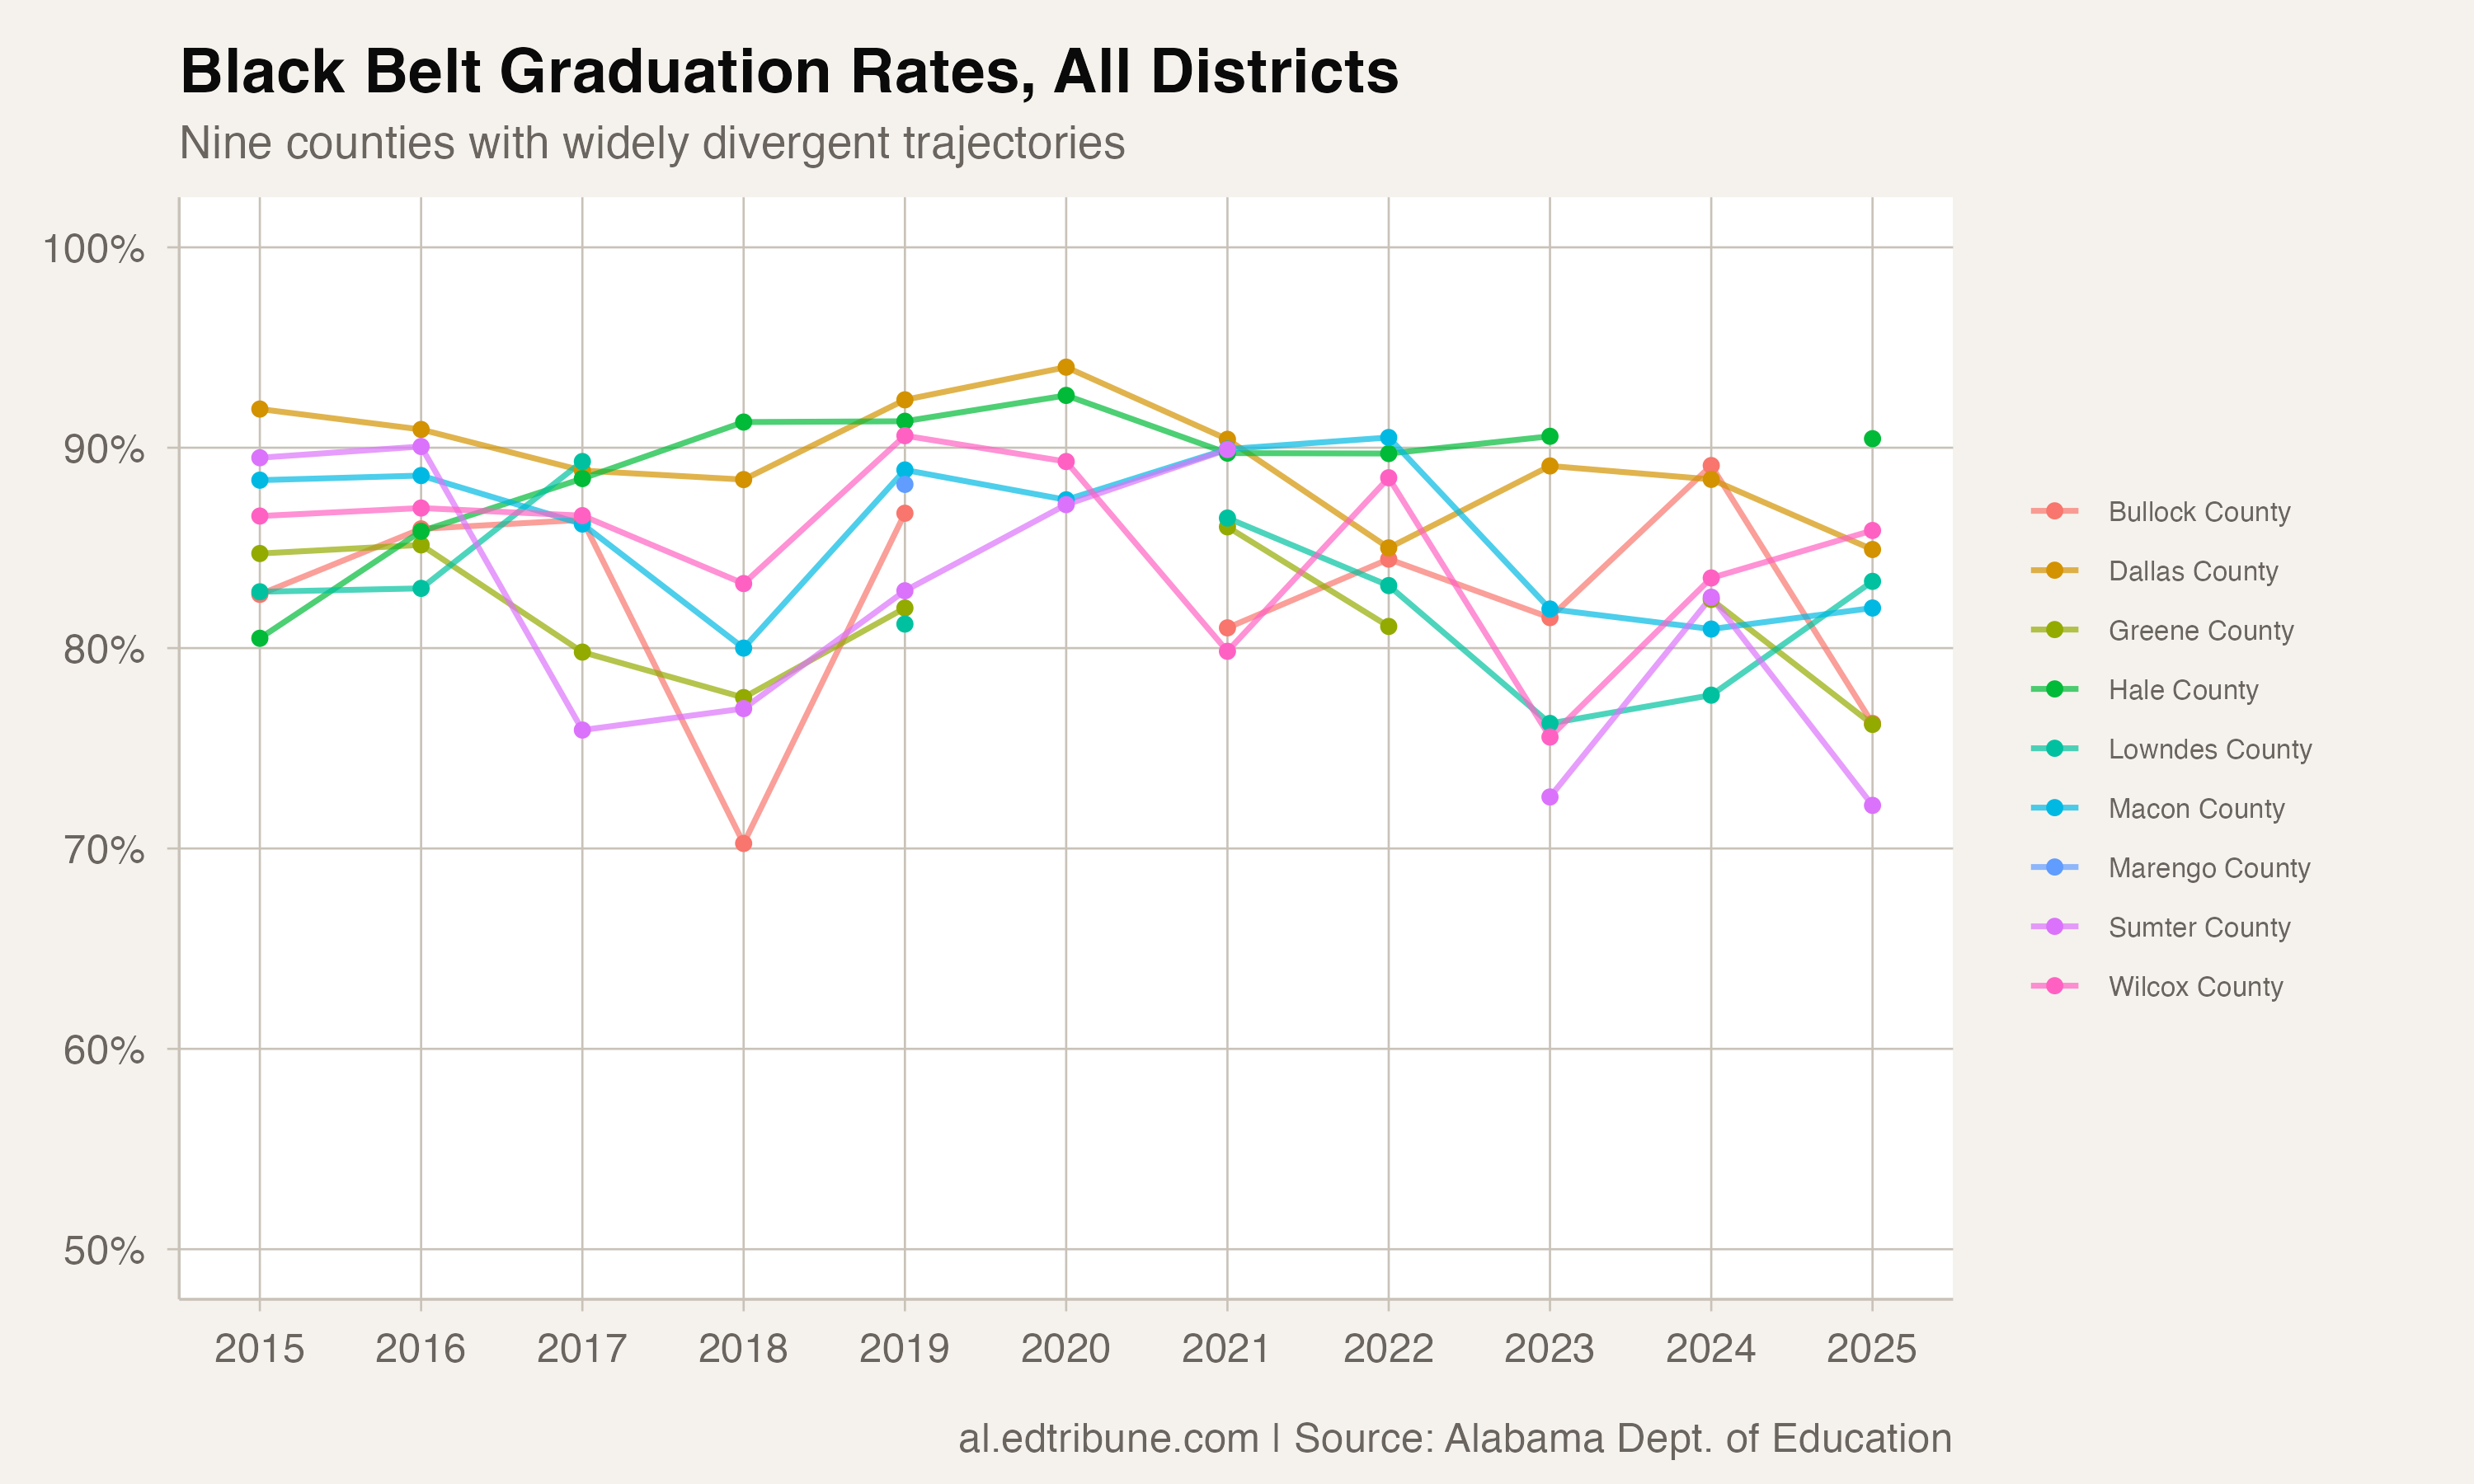
Hale County↗ET rose from 80.5 percent in 2015 to 90.5 percent in 2025, a 10.0 percentage point improvement that has pushed it above the state average. Sumter County↗ET, one county to the west, fell from 89.5 percent to 72.2 percent, a 17.3-point collapse that leaves it among the lowest-performing districts in Alabama.
That is a 27.3 percentage point swing between neighboring counties sharing a border and a history. Whatever story we tell about the Black Belt as a region, these two counties are living different versions of it.
The split across the region
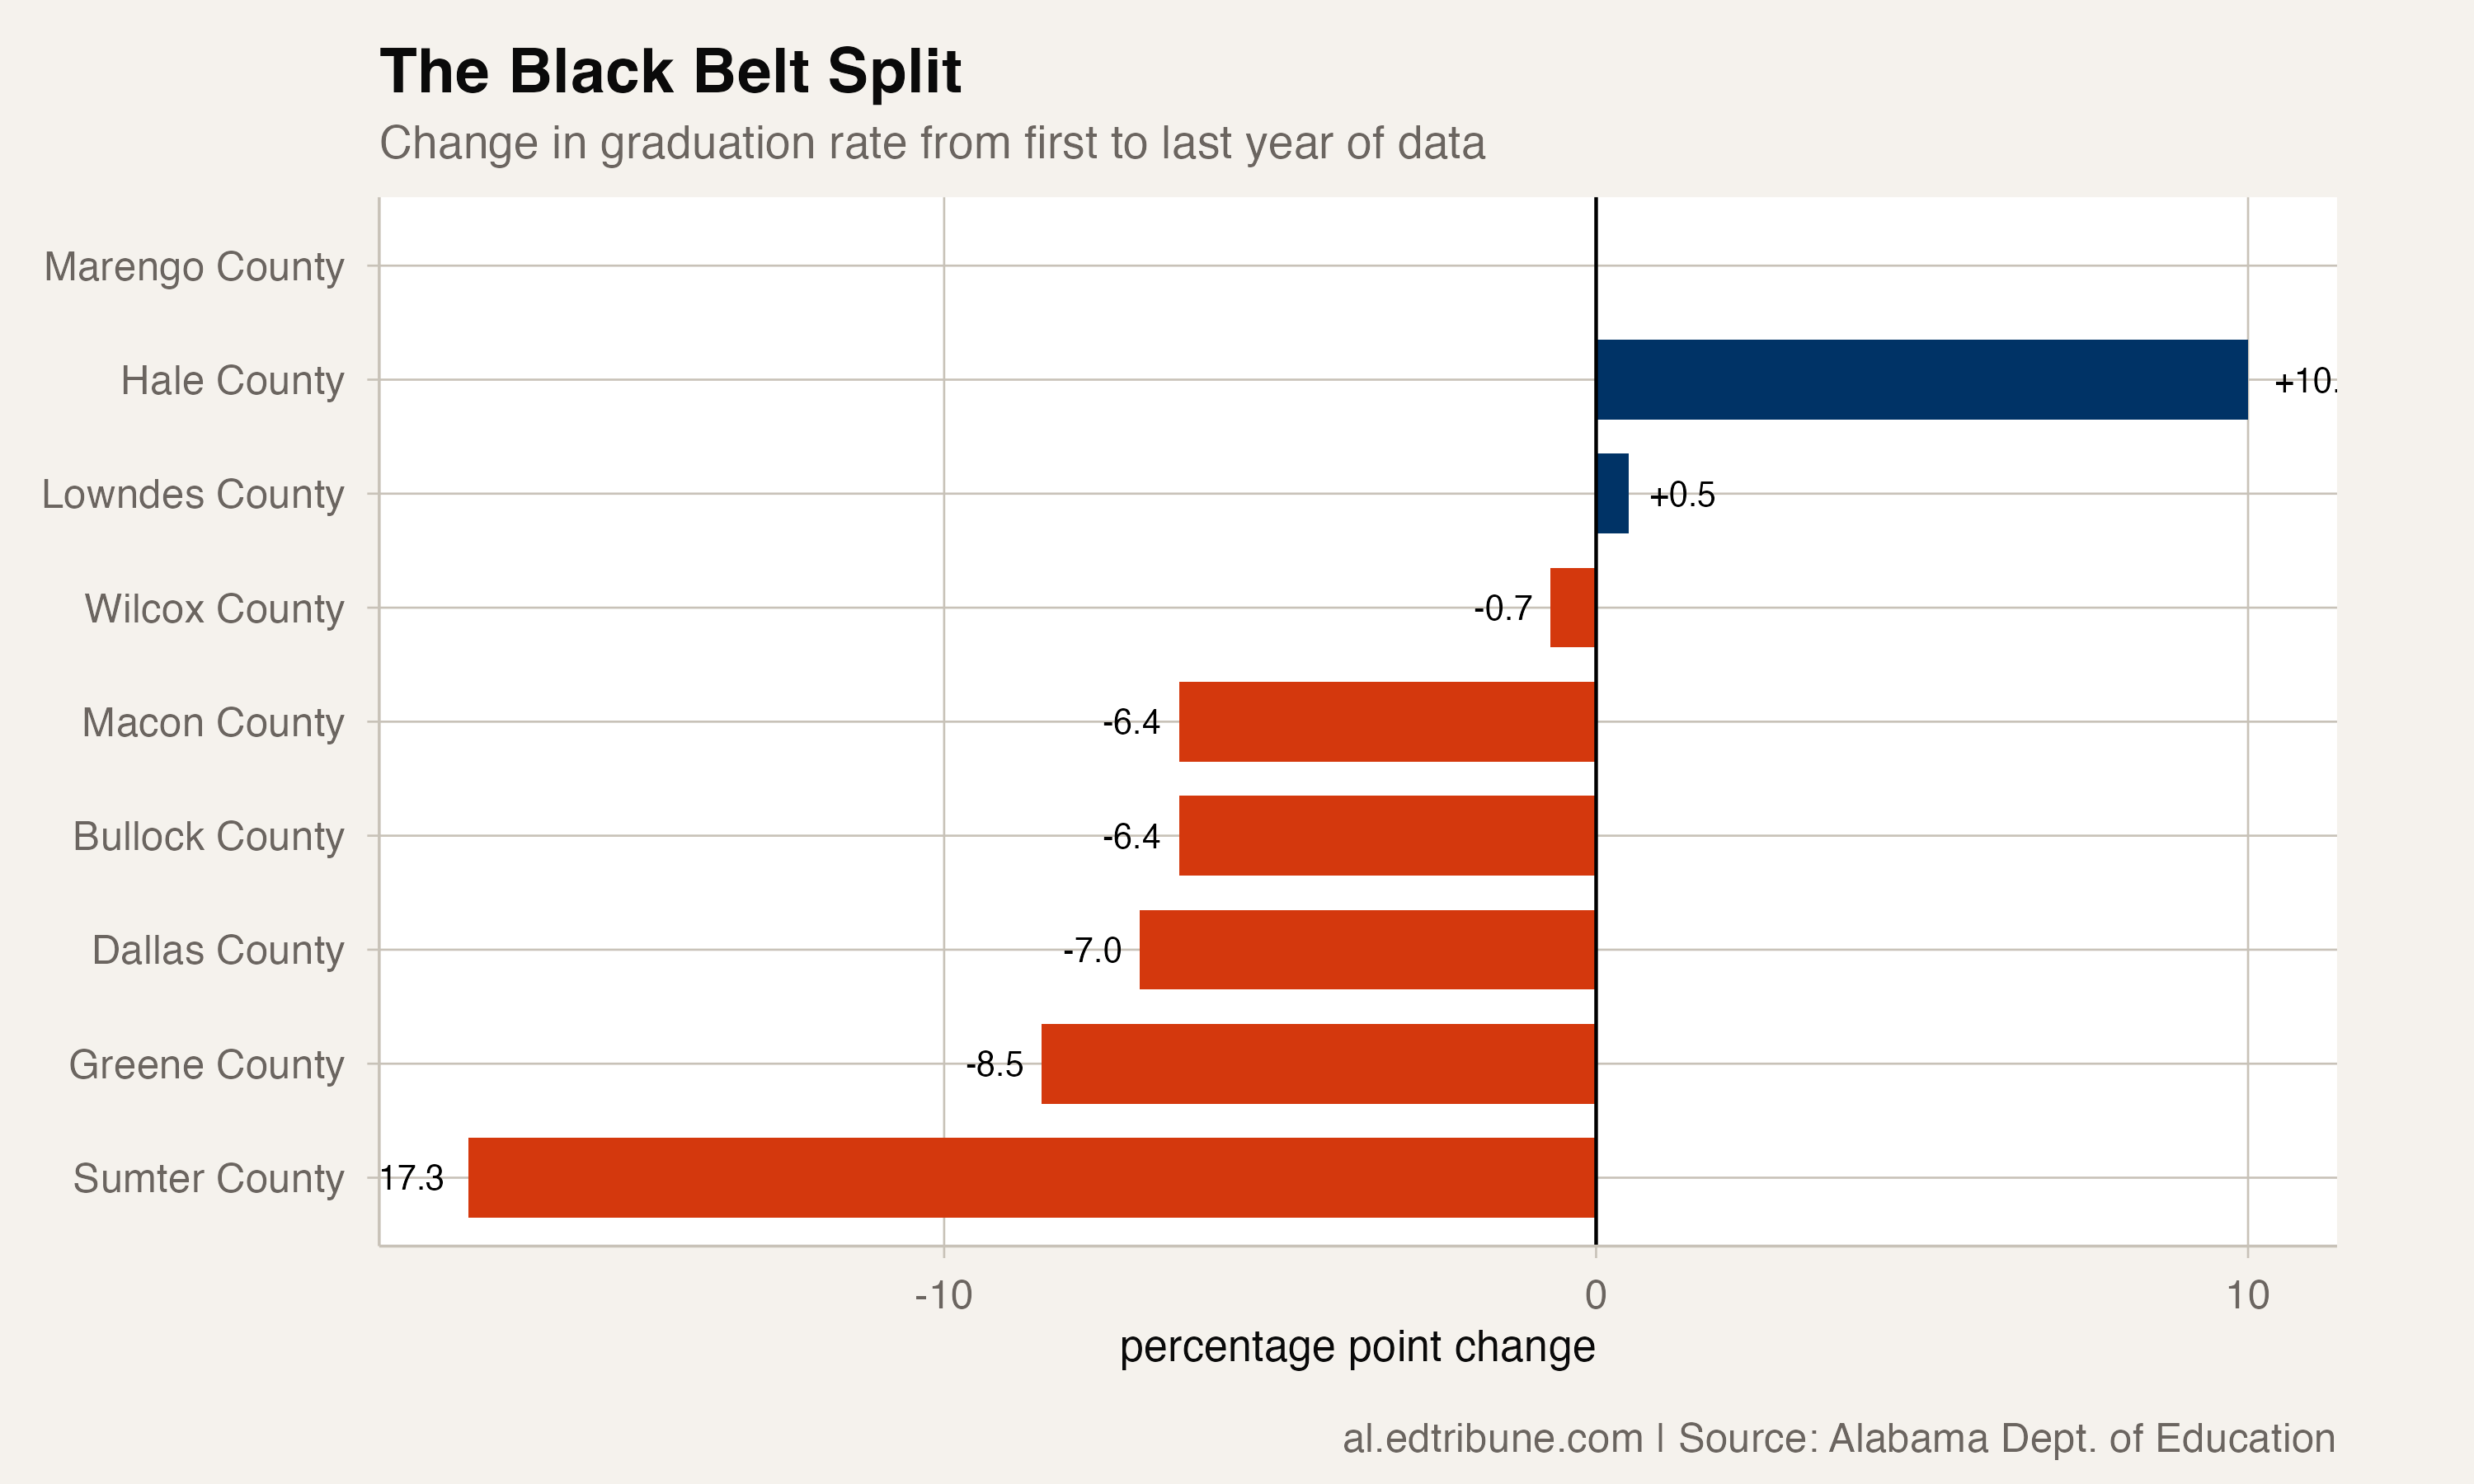
Hale County is not the only improver. Lowndes County↗ET gained 5.1 points. Macon County↗ET gained 6.1 points. Bullock County↗ET gained 4.2 points. These are modest gains in absolute terms, but in a region where any forward motion is news, they represent real progress.
On the other side: Sumter County↗ET lost 17.3 points. Greene County↗ET lost 8.5 points. Dallas County↗ET lost 7.0 points. Marengo County↗ET lost 3.1 points. Wilcox County↗ET lost 3.6 points.
The pattern is not "the Black Belt is failing." It is "the Black Belt is diverging." And that is a harder story to explain than uniform decline.
Where they stand now
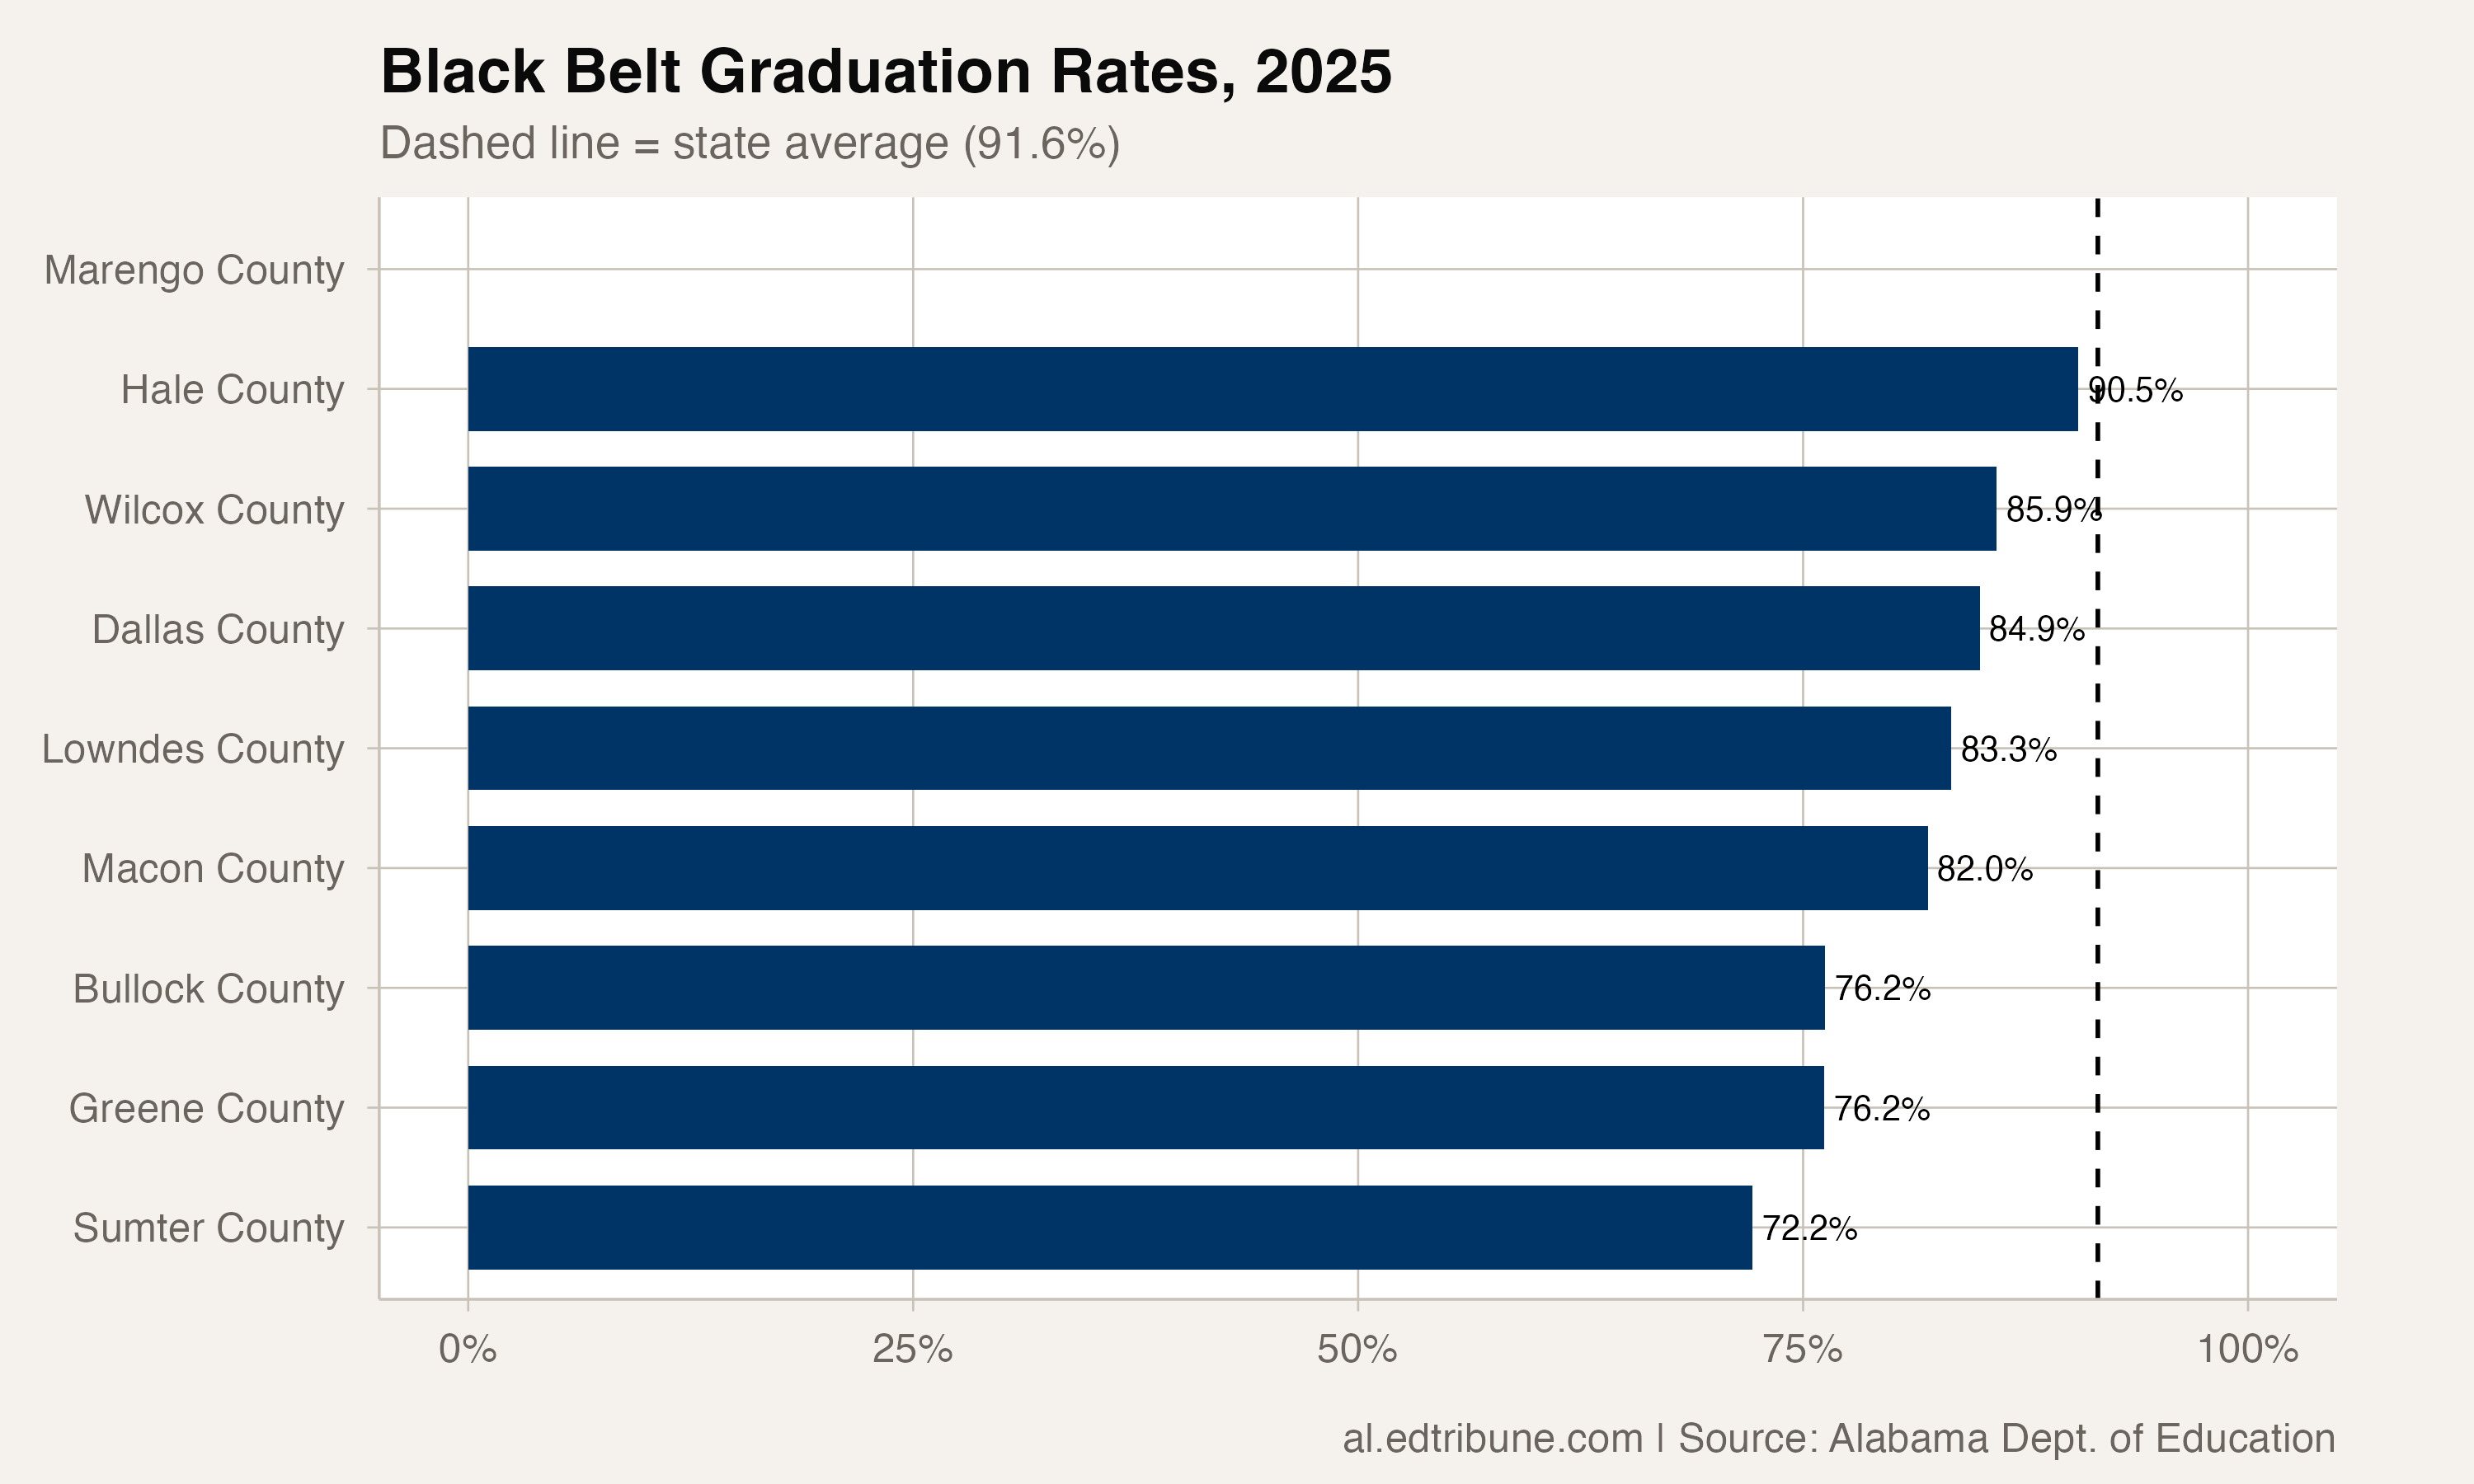
In 2025, Hale County (90.5 percent) is nearly at the state average of 91.6 percent. Sumter County (72.2 percent) is the second-lowest district in the state. The distance between the best and worst in this nine-county region is 18.3 percentage points.
The small-number caveat
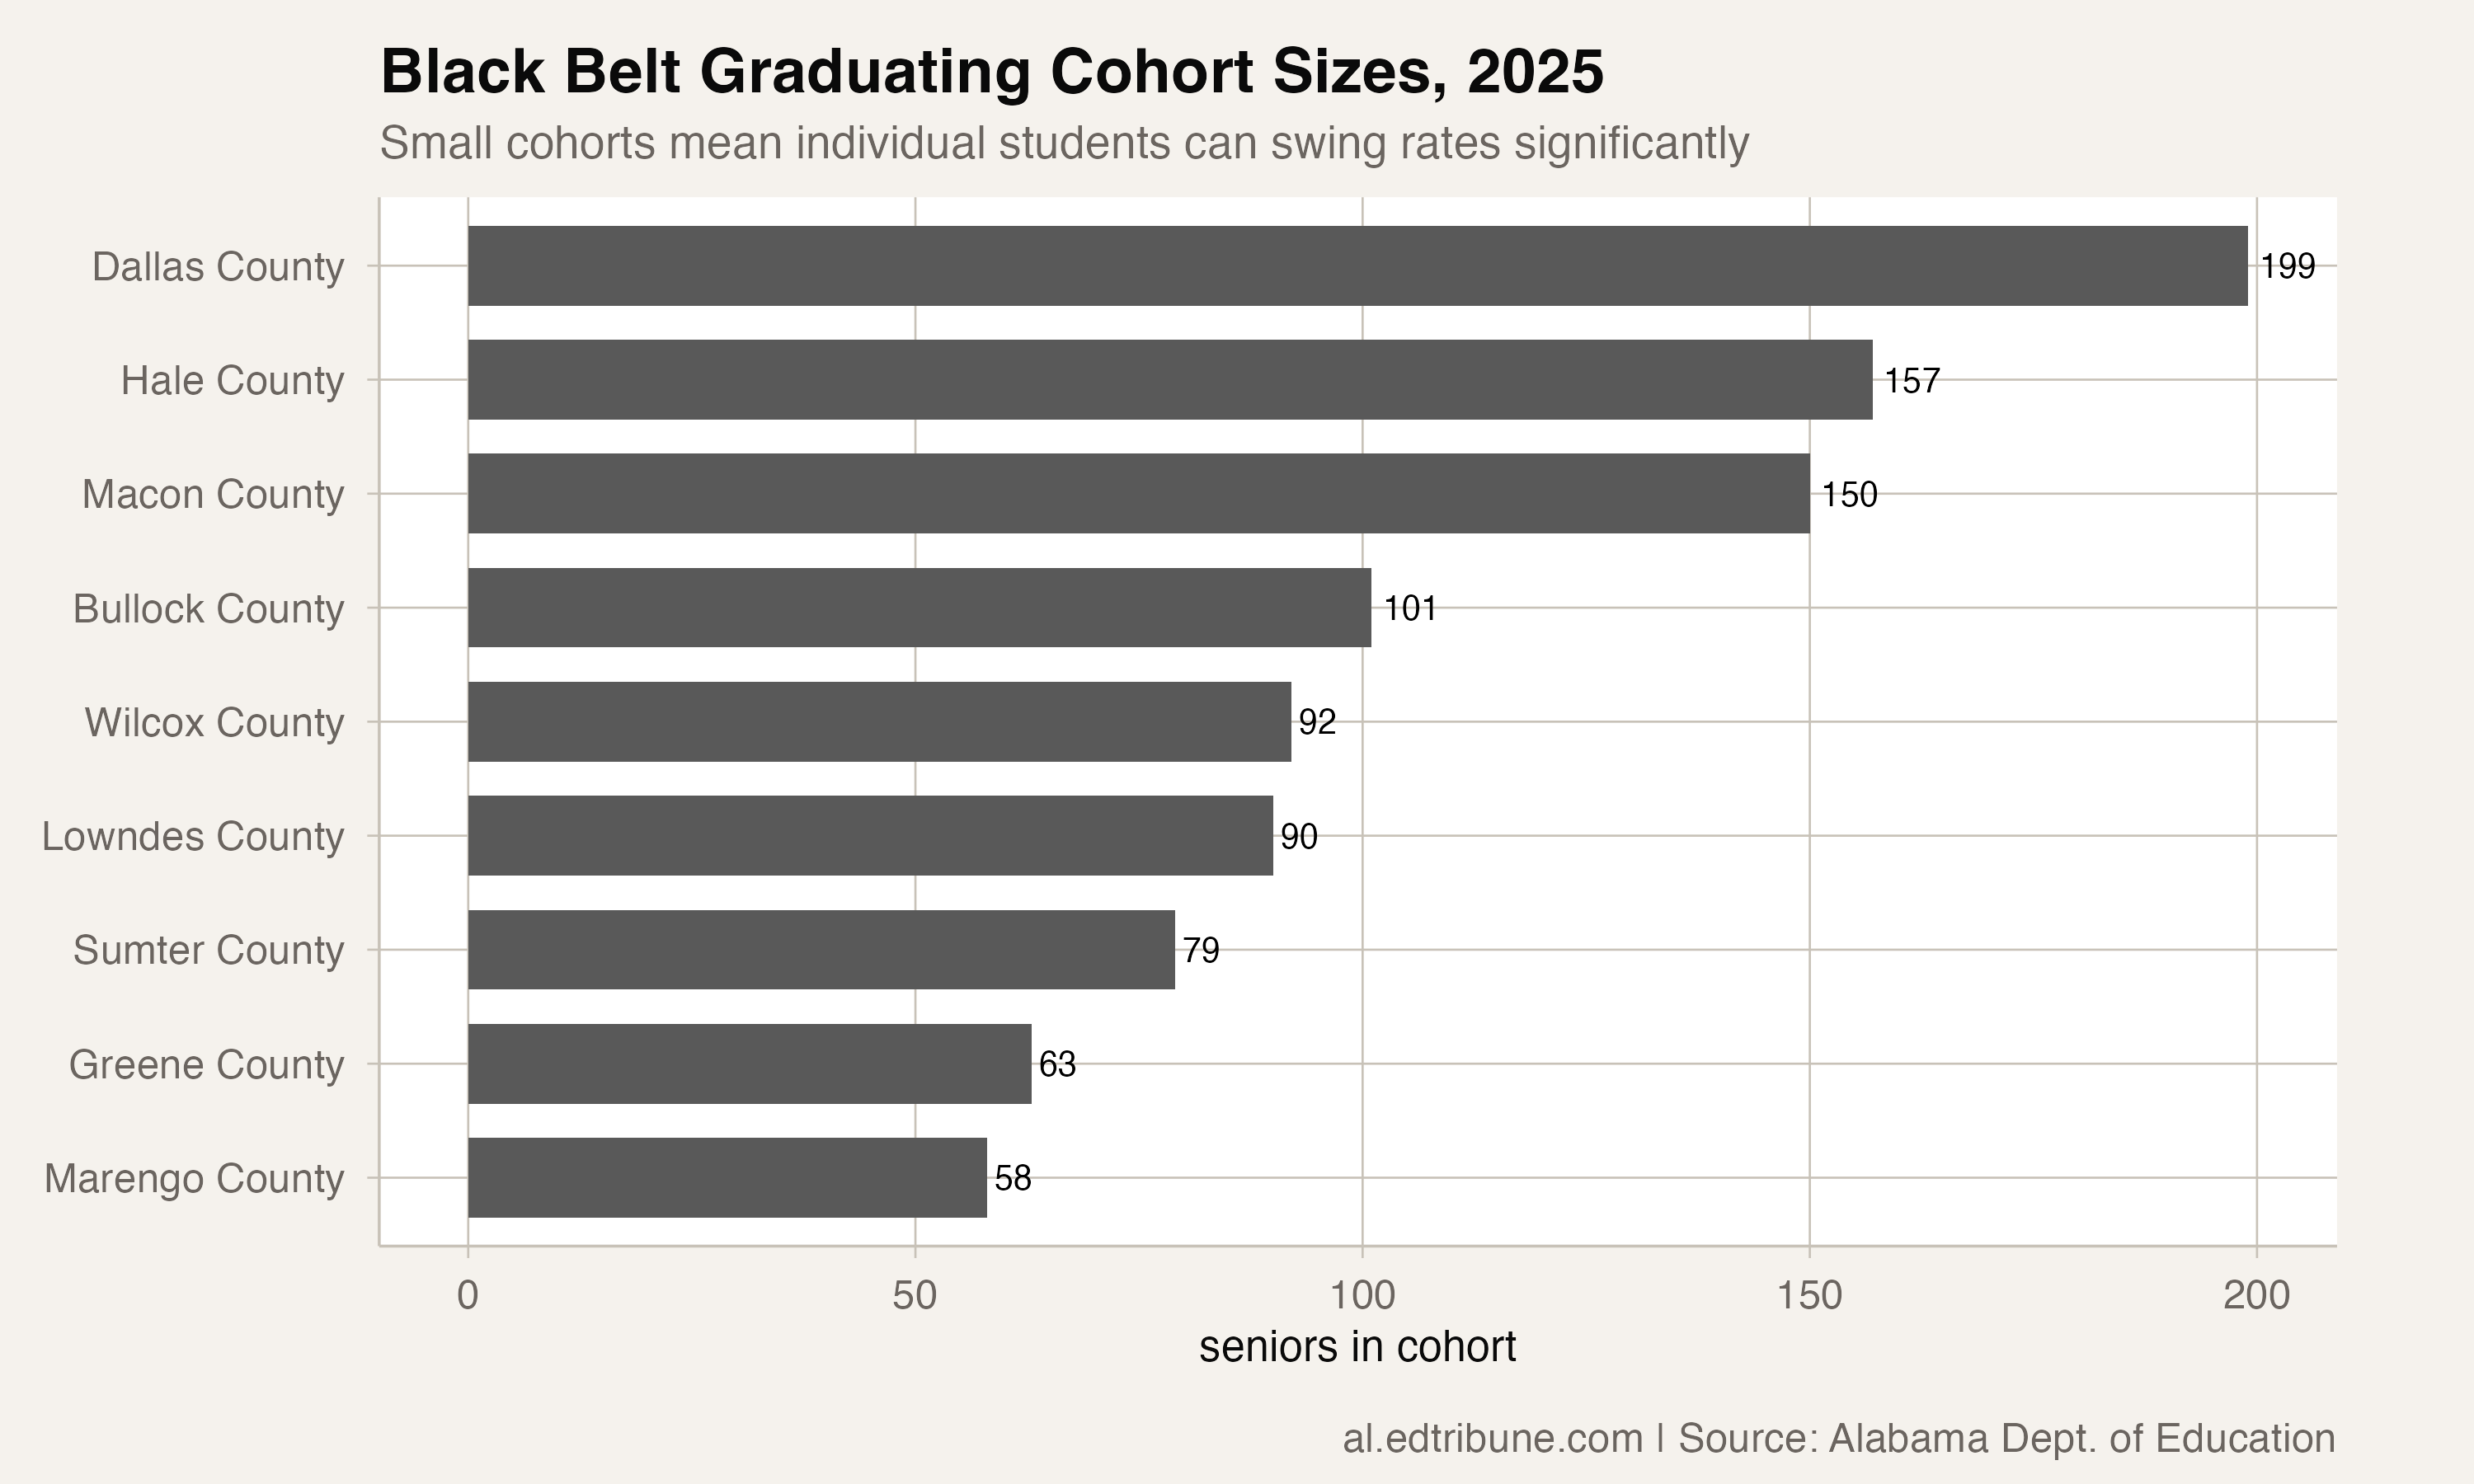
Black Belt districts are small. Hale County graduated roughly 60 seniors in 2025. Sumter County graduated fewer than 50. At those cohort sizes, a handful of students dropping out or staying enrolled can shift the rate by several points in either direction.
This does not mean the trends are meaningless: a 17-point decline over a decade is too large and too sustained to be noise. But it does mean that any single year's number should be read with caution. The trajectories matter more than any individual data point.
What the divergence suggests
If the Black Belt's counties shared identical structural constraints, their graduation trajectories should look roughly similar. The fact that they do not suggests that local factors (district leadership, school culture, community engagement, teacher retention) are producing different outcomes from similar starting positions.
Hale County's rise to 90.5 percent from 80.5 percent did not happen because the county suddenly became wealthy or its students suddenly became different. Something changed inside the schools themselves. Identifying what that something is, and whether it is replicable in Sumter or Greene or Dallas, is the question the divergence raises.
By the numbers: 27.3 percentage points, the swing between Hale County (+10.0pp) and Sumter County (-17.3pp) over the past decade. Same region, same demographics, opposite results.
Detailed code that reproduces the analysis and figures in this article is available exclusively to EdTribune subscribers.
Discussion
Sign in to join the discussion.
Loading comments...