Correction: An earlier draft treated the annual gap as literally flat, overstated the district evidence, and used an incorrect estimate of the number of additional graduates implied by the gap.
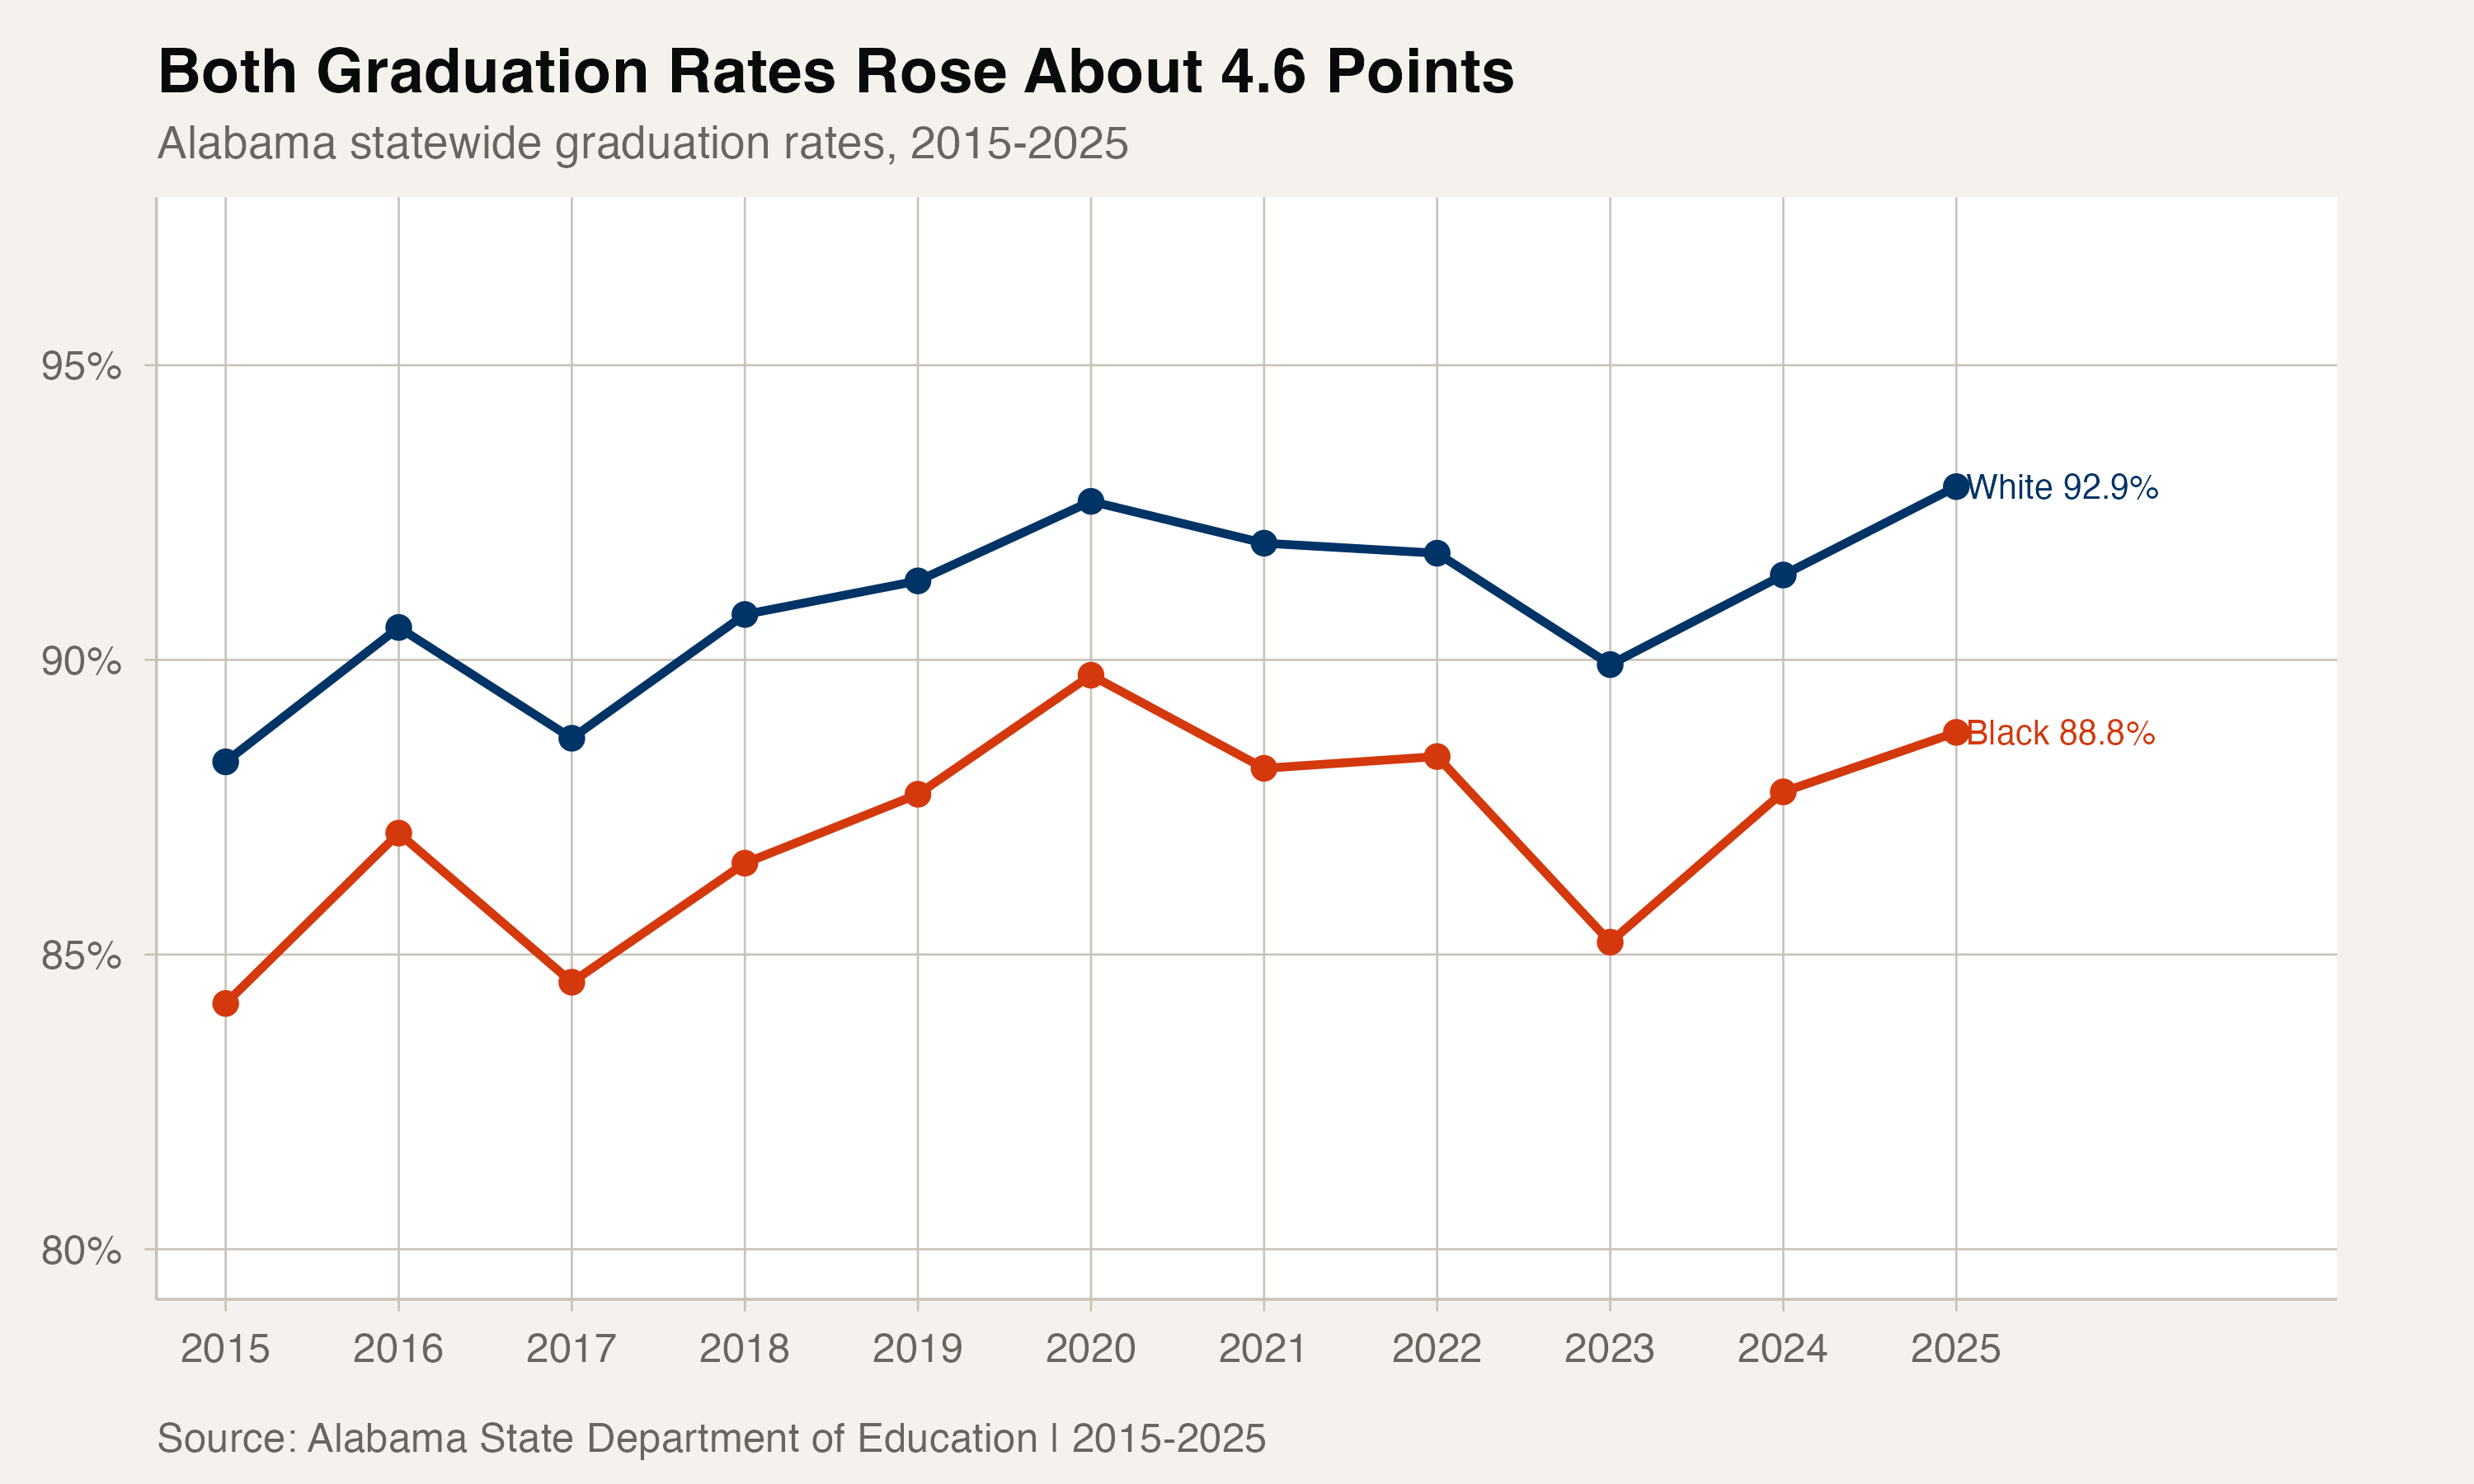
In 2015, White students in Alabama posted an 88.3% graduation rate, compared with 84.2% for Black students. The difference was 4.1 percentage points.
In 2025, the White rate was 92.9% and the Black rate was 88.8%. The gap was 4.2 points.
Across that ten-year span, the White rate rose 4.7 points and the Black rate rose 4.6 points. The endpoint gap widened by 0.1 point after rounding, even though it moved up and down in the intervening years.
Eleven reports, a gap between 3.0 and 4.7 points
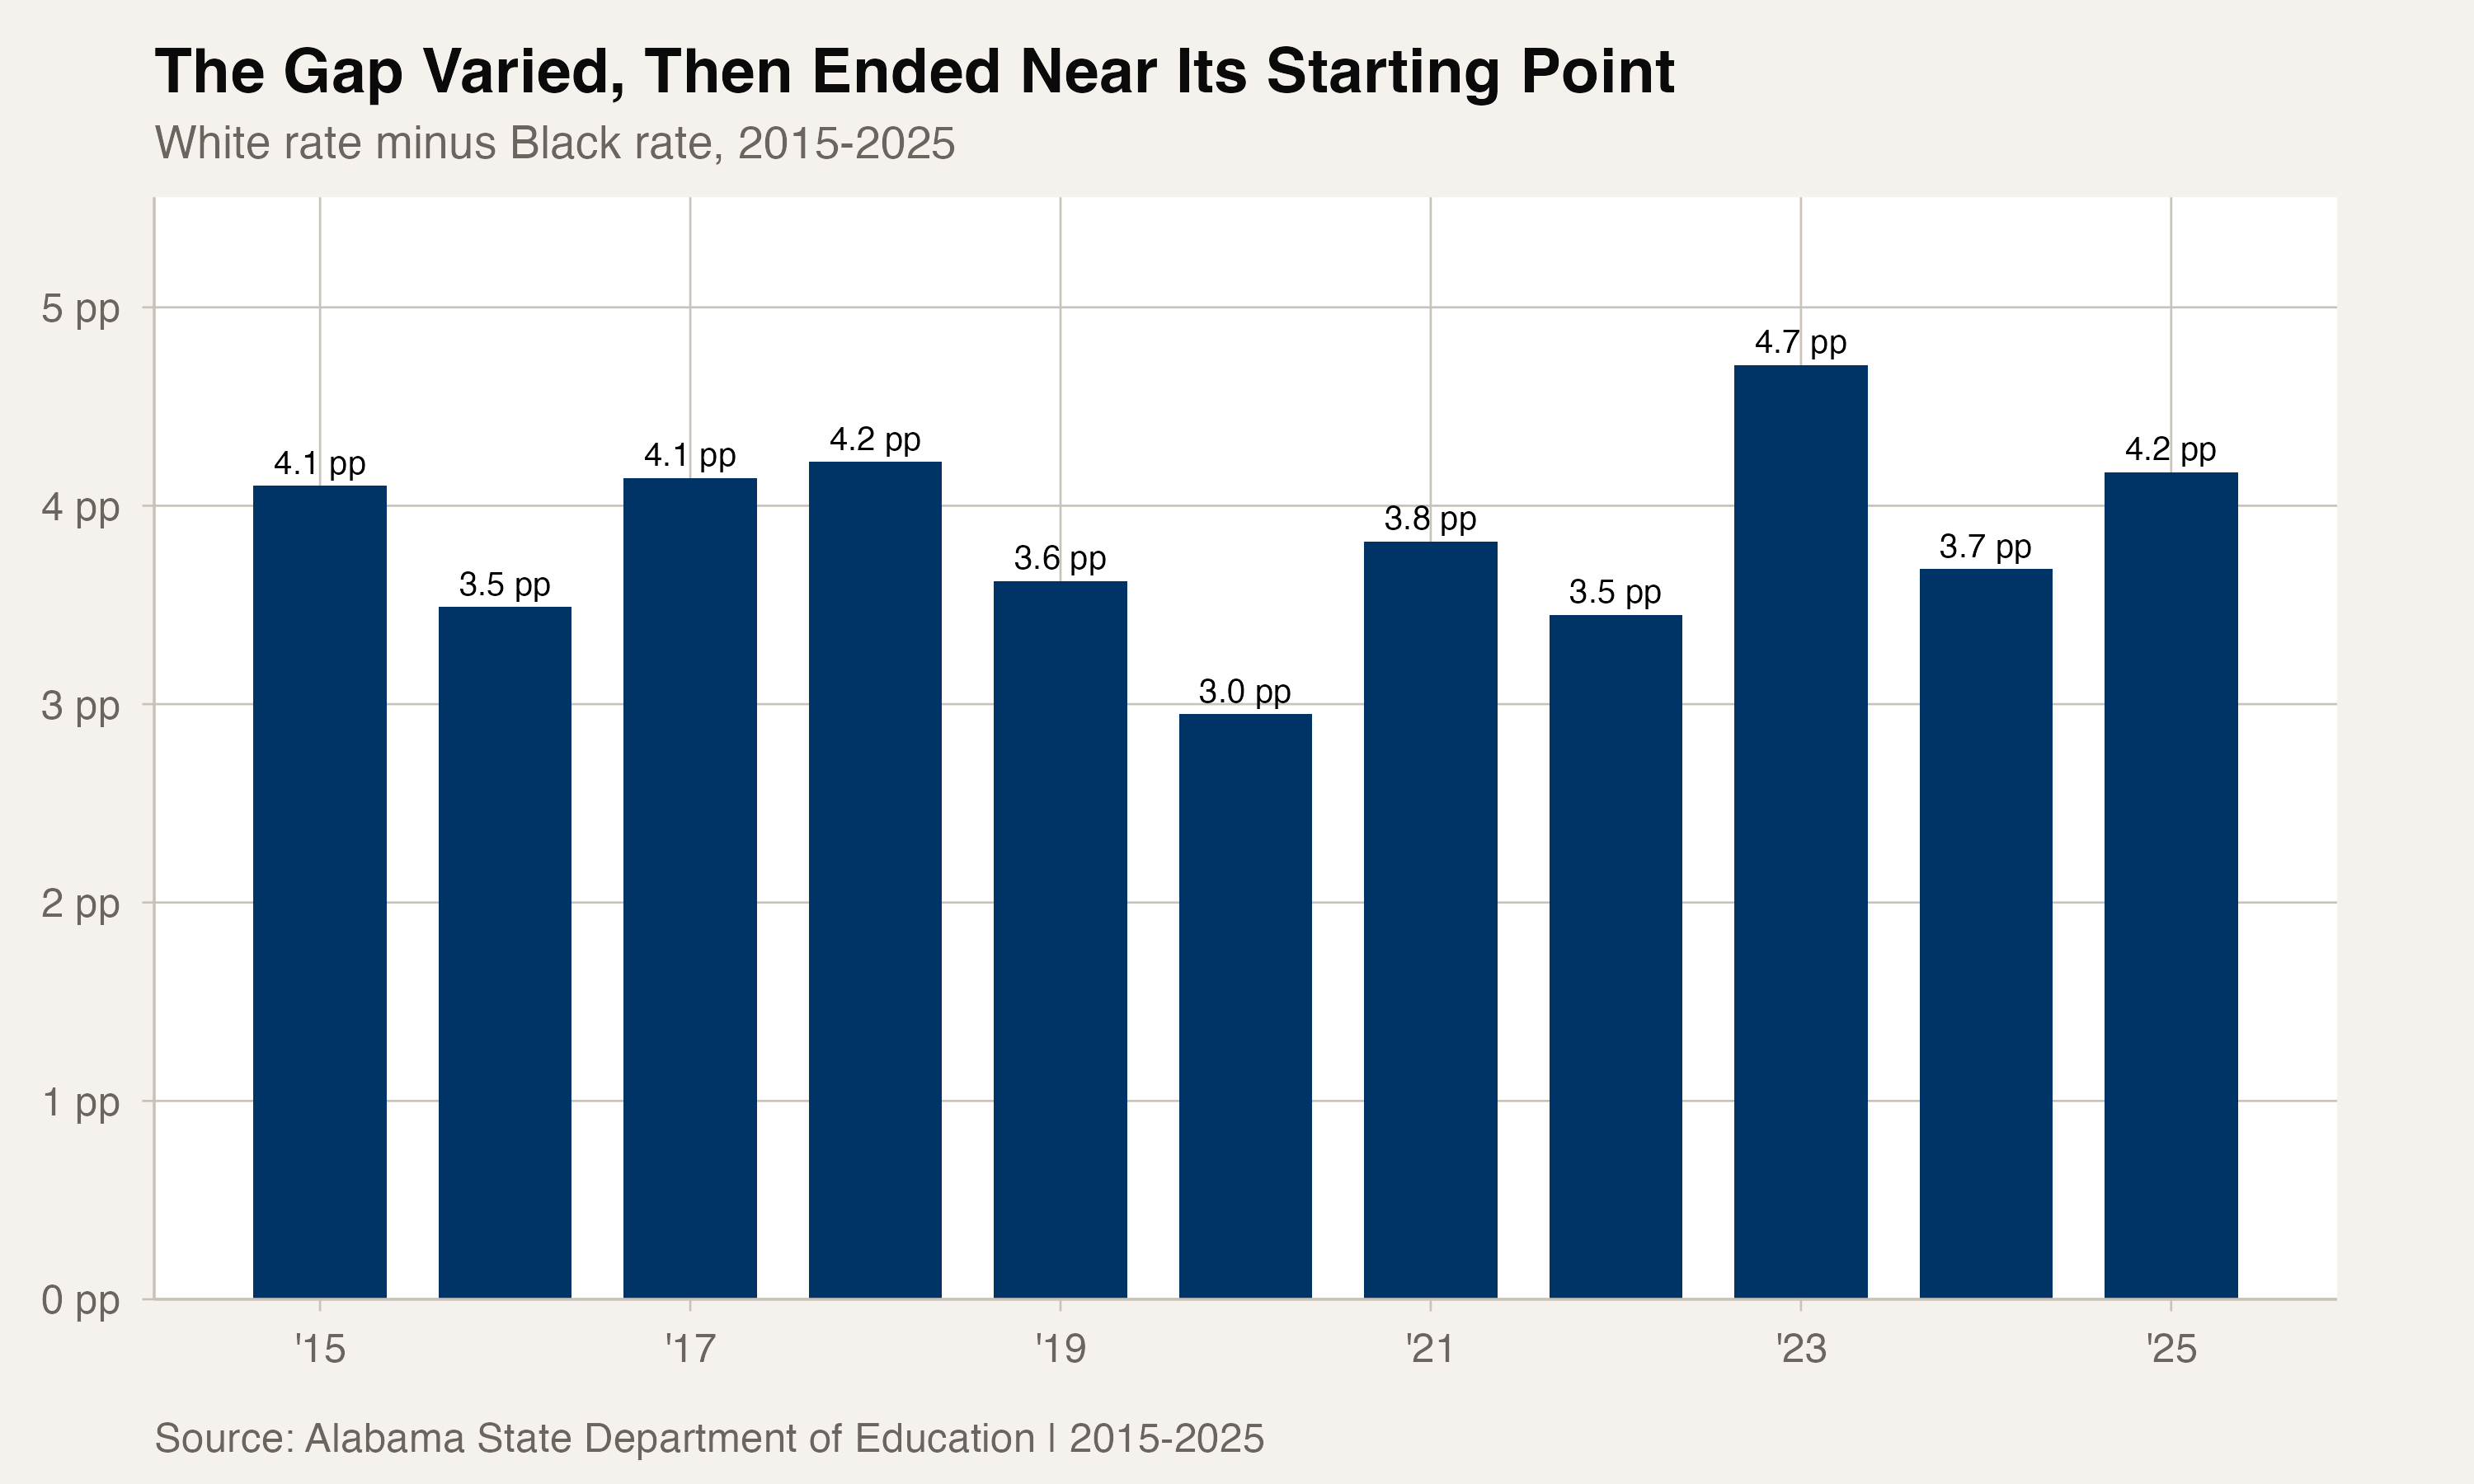
The annual White-Black gap averaged 3.9 points across the 11 reports from 2015 through 2025. It was narrowest in 2020 at 3.0 points and widest in 2023 at 4.7 points.
That variation matters. The evidence supports endpoint near-stasis across a decade, not a claim that the gap was unchanged every year.
The rates moved together, but not by equal amounts
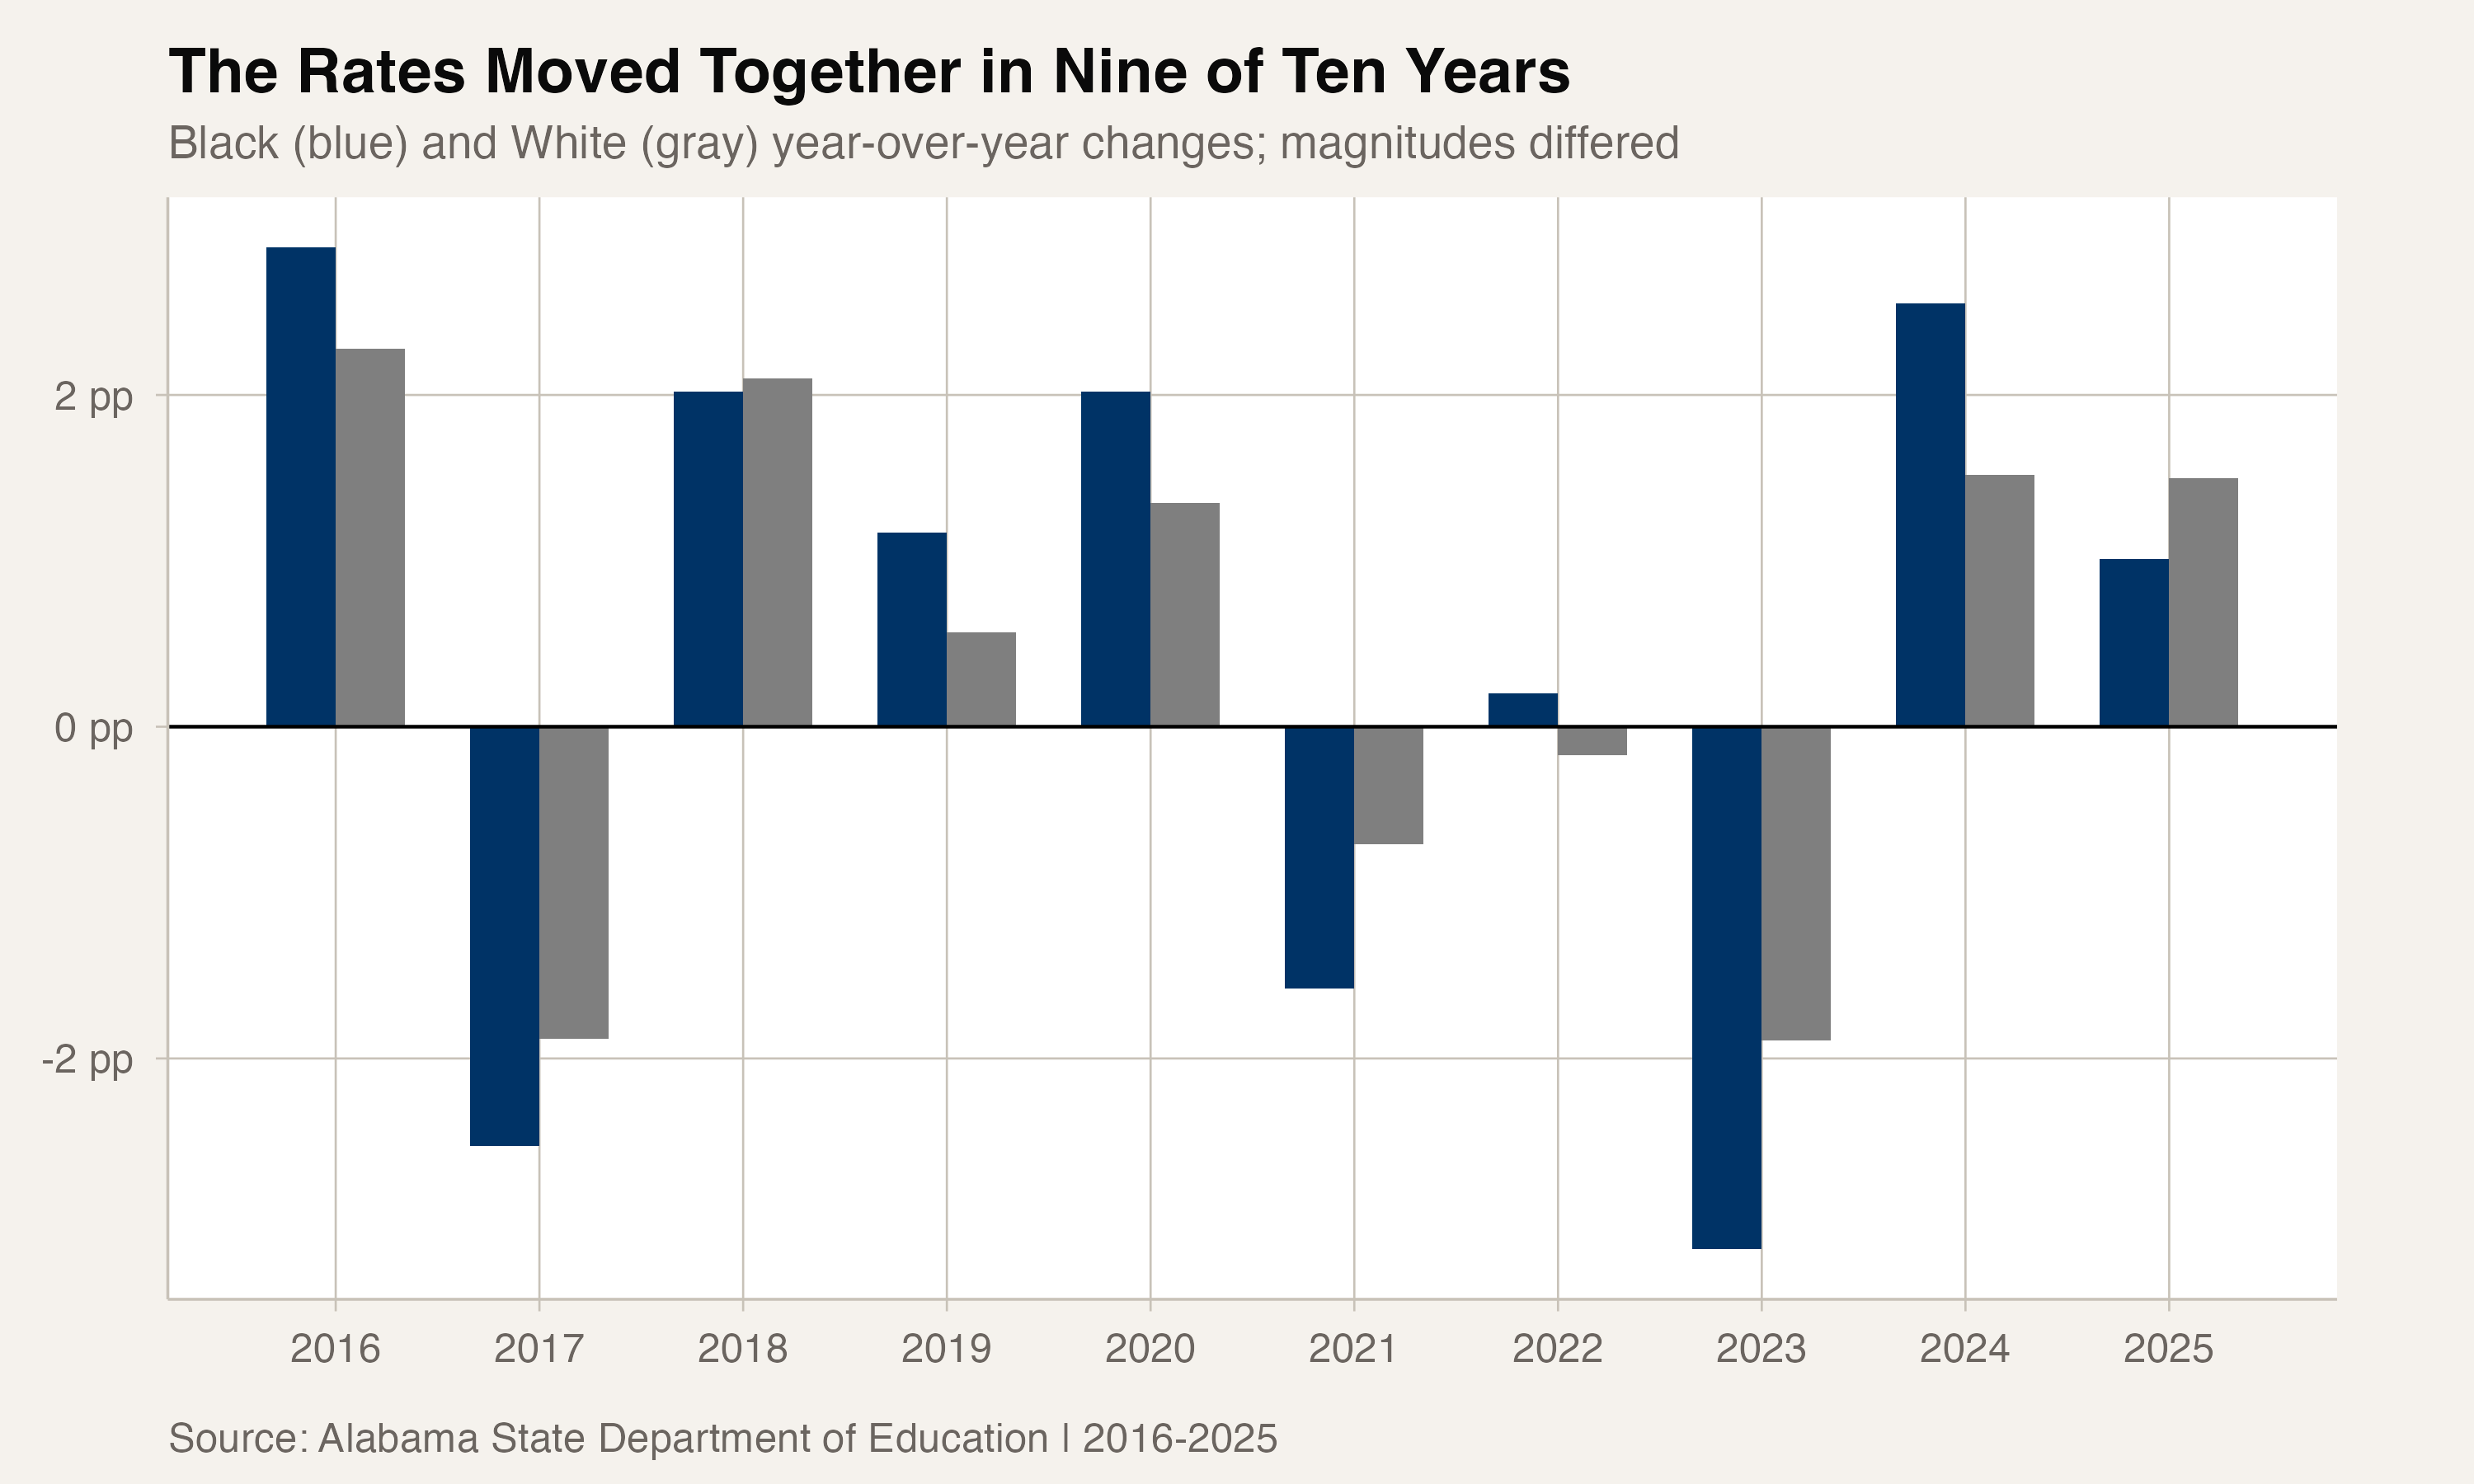
White and Black graduation rates moved in the same direction in nine of the 10 year-over-year transitions. The exception was 2022, when the White rate fell 0.2 point and the Black rate rose 0.2 point. Their changes were not identical in the other years, either.
In 2023, the White rate fell 1.9 points while the Black rate fell 3.2 points. That widened the gap by 1.3 points. In 2024, the rates rose 1.5 and 2.6 points, respectively, narrowing the gap by 1.0 point. In 2025, the White rate rose 1.5 points and the Black rate rose 1.0 point, widening the gap by 0.5 point.
A count-backed counterfactual
The 2025 Black cohort included 16,756 students, of whom 14,875 were reported as graduates. Applying the exact White graduate share to the Black cohort produces a rate-equivalent of about 697 additional graduates.
Repeating that calculation with each year's exact cohort and graduate counts produces a sum of about 7,666 rate-equivalent graduates across the 11 cohorts from 2015 through 2025. This is a counterfactual benchmark, not a count of observed students who would necessarily have graduated under a particular intervention.
Only 17 districts met the comparison threshold
District-level rates were finite for both groups in only 17 districts with at least 20 students in each cohort. The White rate was higher in nine of those districts; the Black rate was higher in eight.
Chickasaw City had the largest absolute gap: its Black rate of 79.4% was 20.8 points above its White rate of 58.6%. Crenshaw County had the largest gap in the other direction, with an 88.7% White rate and a 74.1% Black rate, a 14.5-point difference. Mobile County's two rates differed by 0.1 point.
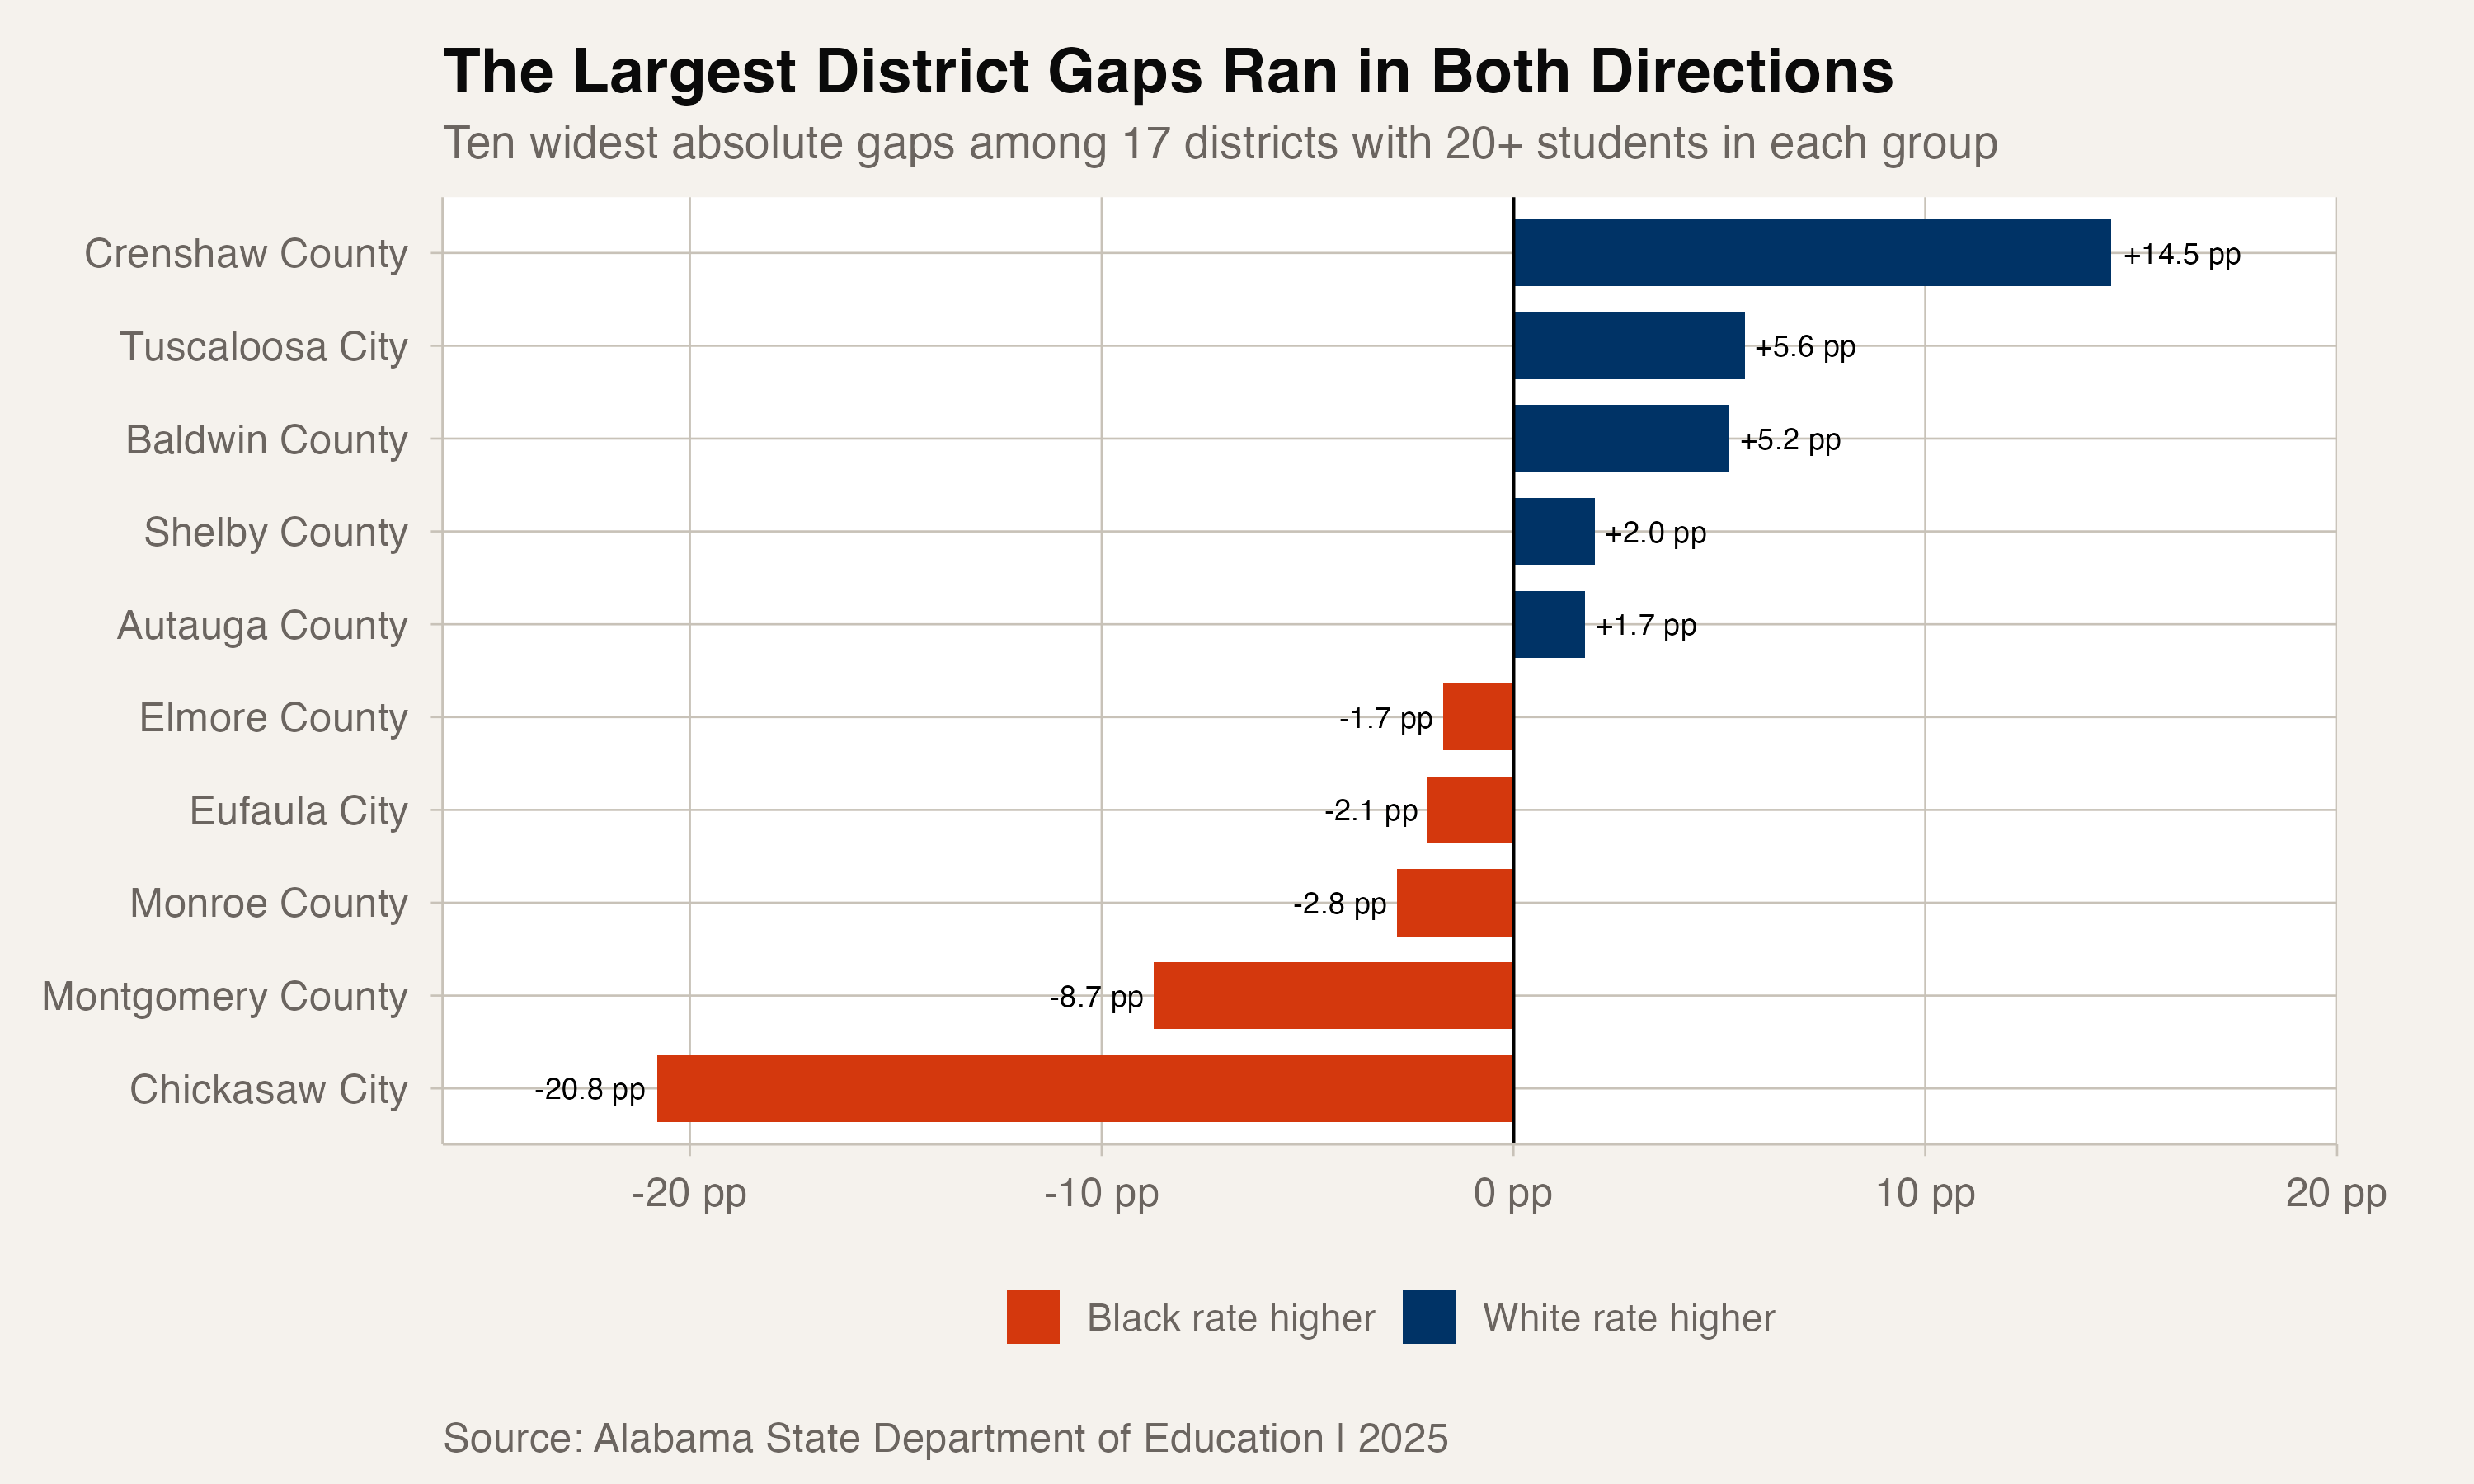
The limited reporting universe blocks broad conclusions about suburban, rural, or urban districts. Alabama's district rows also lack stable district IDs, so this analysis uses exact district names after removing exact duplicate cache records.
The Black gap was not the widest reported racial gap
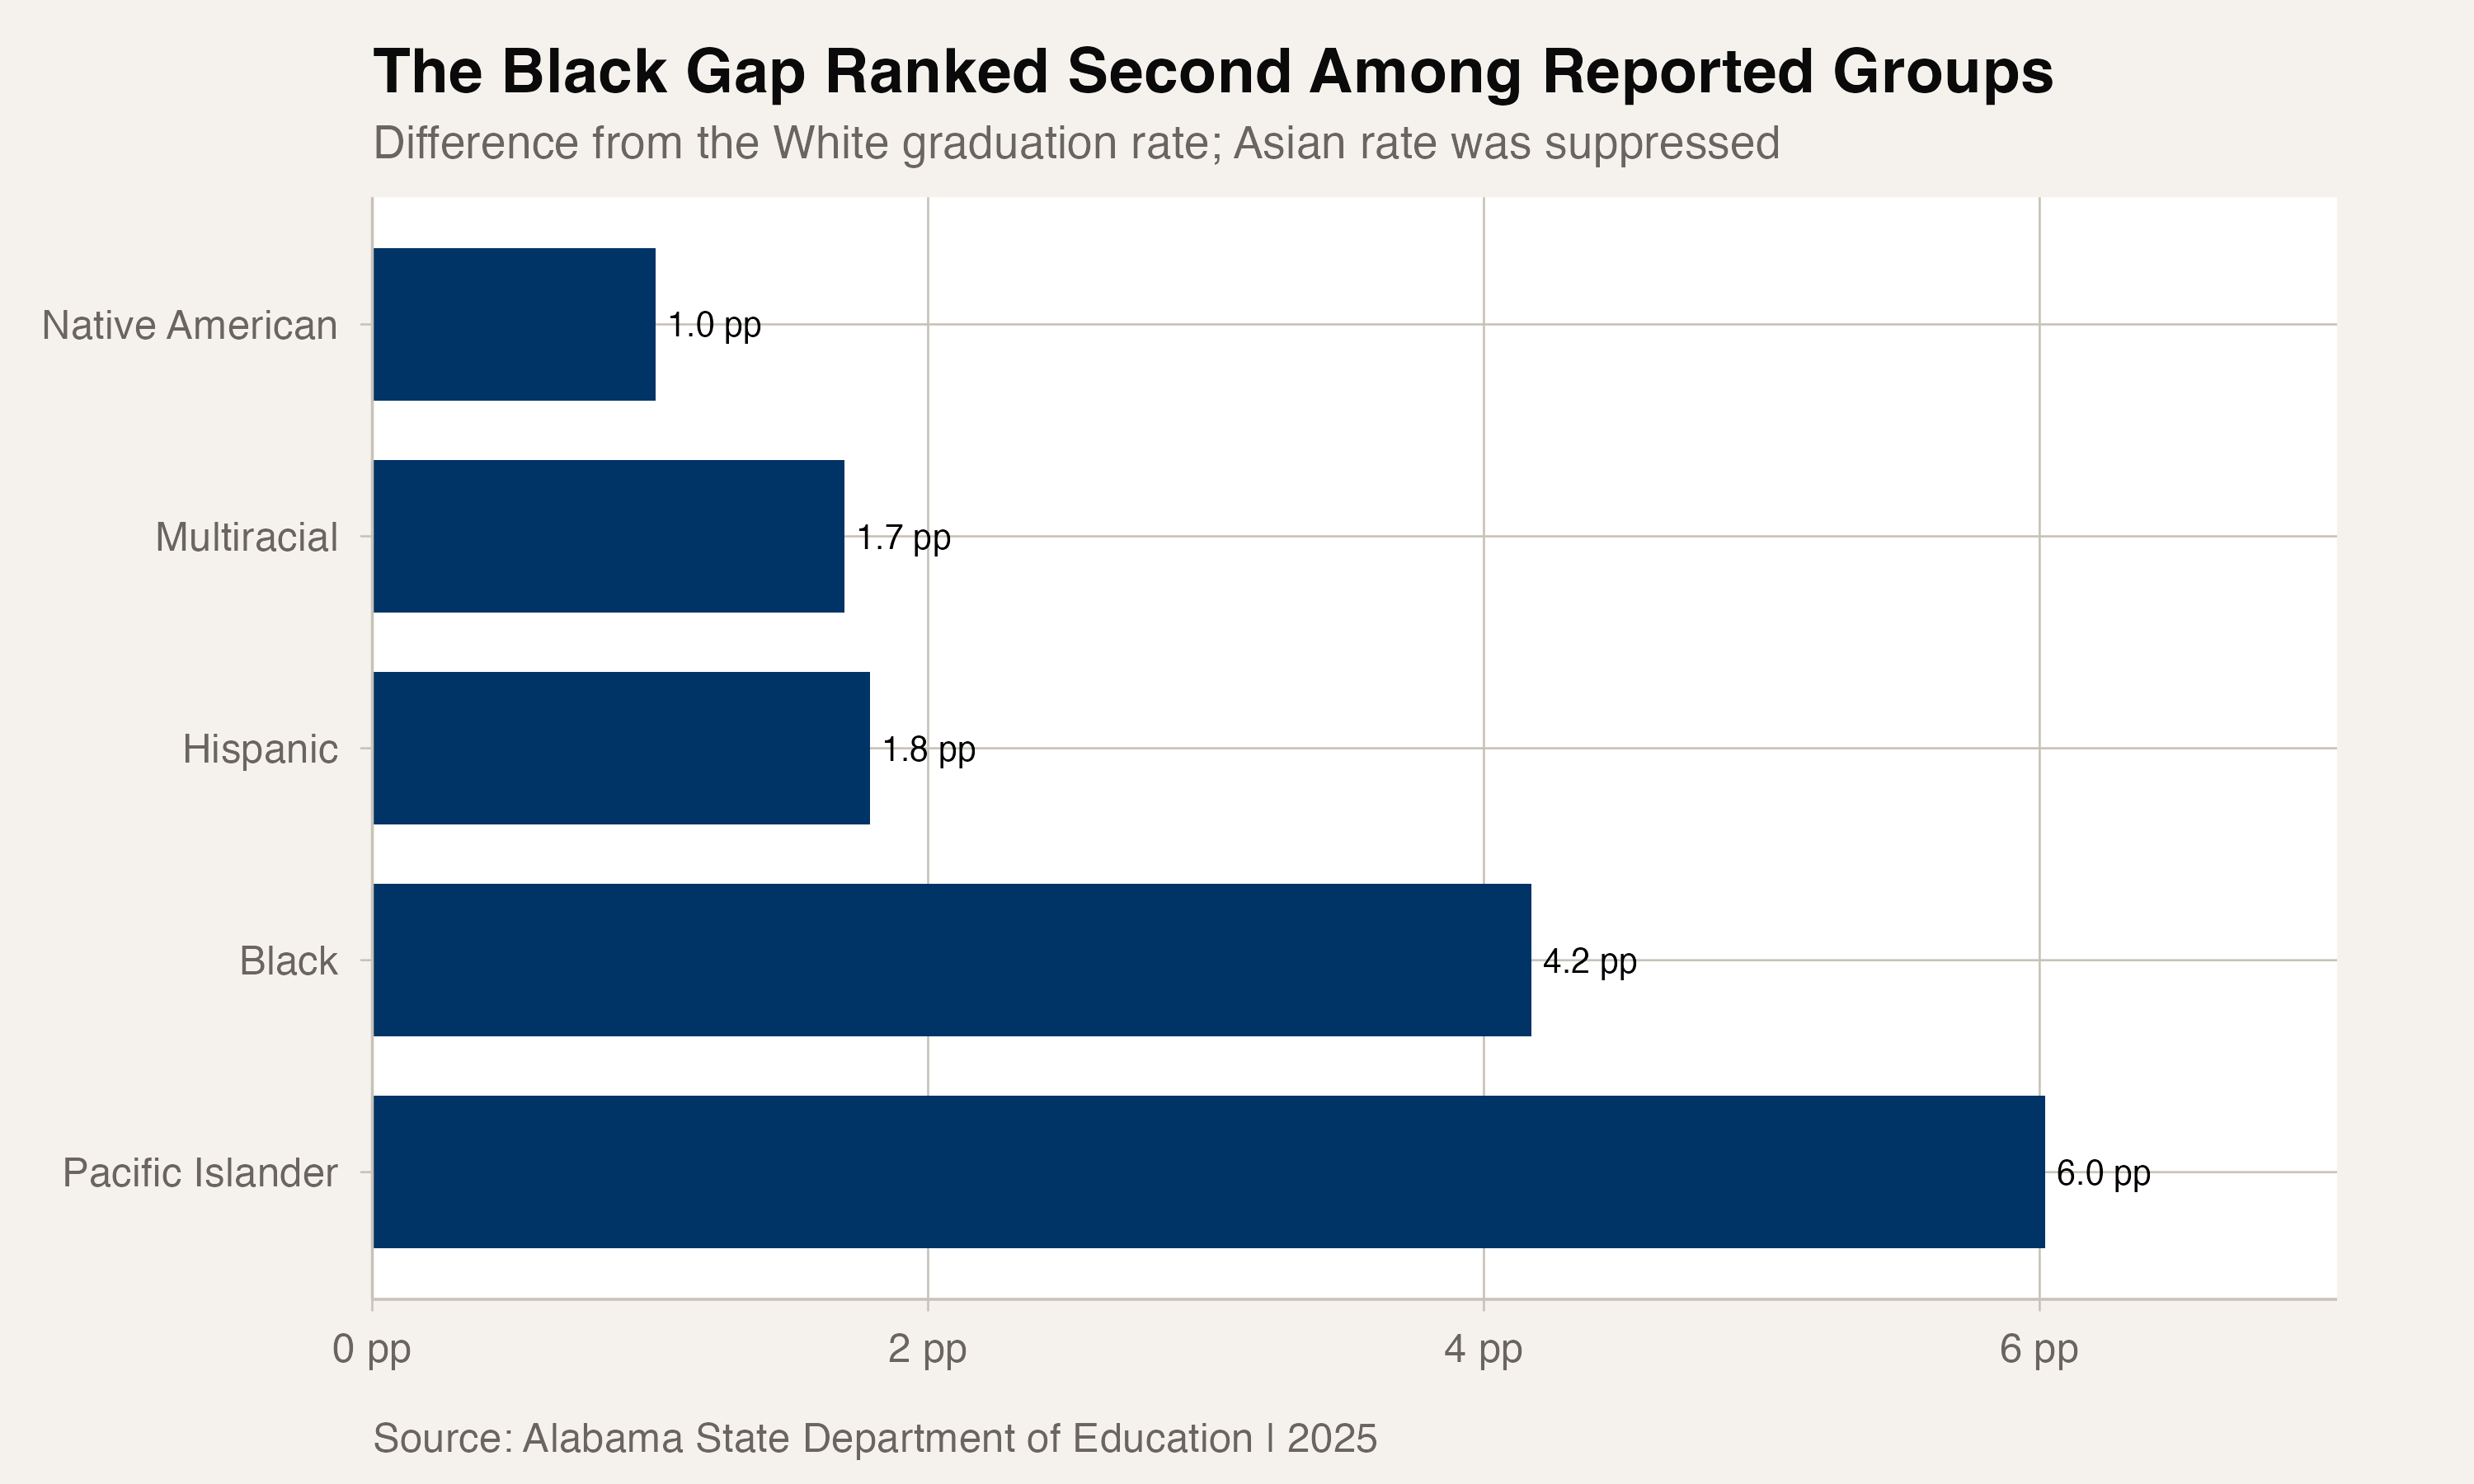
Among five non-White race or ethnicity groups with finite statewide rates in 2025, the 4.2-point Black gap ranked second. The Pacific Islander gap was 6.0 points, based on a cohort of 130 students. The Asian rate was suppressed, so it is excluded from the ranked comparison.
What the data cannot explain
The graduation records establish the rates, gaps, cohorts, and reporting patterns. They do not identify why the gap remained near its starting level.
Career pathways, accountability policy, school leadership, residential segregation, school funding, and discipline are unresourced as mechanisms in this analysis. The fact that both rates moved in the same direction in nine of 10 annual transitions is suggestive context for shared statewide conditions, but it does not identify a cause.
Detailed code that reproduces the analysis and figures in this article is available exclusively to EdTribune subscribers.
Discussion
Sign in to join the discussion.
Loading comments...